


Chapter contents:
Systematics
— 1. Taxonomy
— 2. Phylogenetics
—— 2.1 Reading trees
—— 2.2 Building trees ←
—— 2.3 Character mapping
—— 2.4 Phylogenetic trees and classification
Choosing the Terminal Taxa
The first step in building a phylogenetic tree is to determine which group of taxa you wish to analyze; this set of taxa constitutes the ingroup. Depending on the scale of your study, the ingroup taxa might be very closely related to one another or not closely related at all. For example, a phylogenetic analysis of rabbits would include an ingroup composed entirely of different species of rabbits. On the other hand, a phylogenetic study of mammals might include a variety of very different species, ranging from echidnas to opossums to blue whales. Below is an example of ingroup taxa representing tetrapods (four-limbed vertebrates); we have sampled only a small handful of animals from this group.
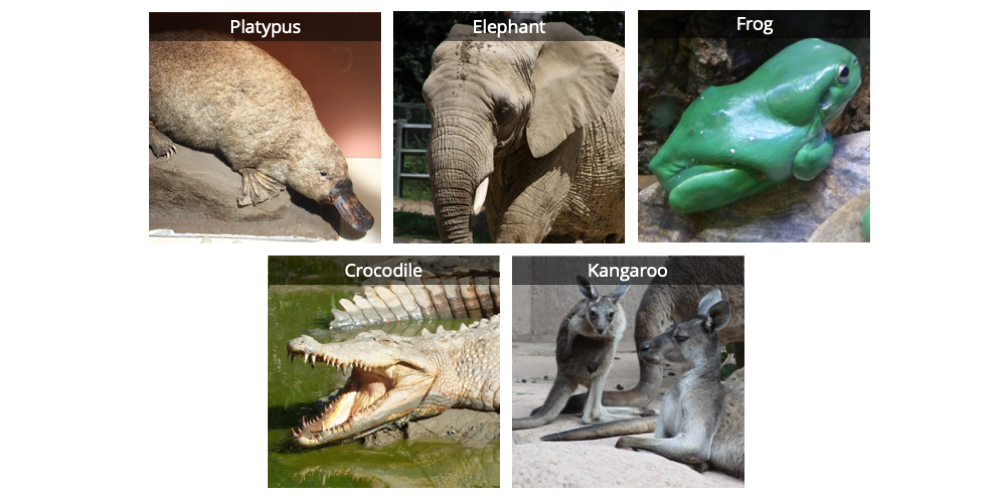
Five vertebrates: a duck-billed platypus, an elephant, a frog, a saltwater crocodile, and a kangaroo. Image by Jonathan R. Hendricks; licensed under a Creative Commons Attribution-ShareAlike 4.0 International License.
Ideally, the ingroup should be taxonomically sampled as completely as is feasible. If one genus of plants is analyzed, an attempt should be made to include every species in that genus. If a broader ingroup–such as a phylum of animals–is studied, representatives of each major subgrouping (e.g., one species from each family) should be included. Practical considerations, however, often limit our ability to sample an ingroup as much as we might prefer. For example, some species might be endangered or live in areas that are not easily accessed. Others might be poorly known or not well represented in natural history collections.
In addition to an ingroup, one or more taxa representing the outgroup are also typically selected. As the word suggests, outgroup taxa fall outside the group of interest. Taxa thought to be closely related to the ingroup are typically selected as outgroup taxa. One function of an outgroup is to root a phylogenetic tree, or establish where the base of the tree is. Let us consider our outgroup to be represented by an angel fish.
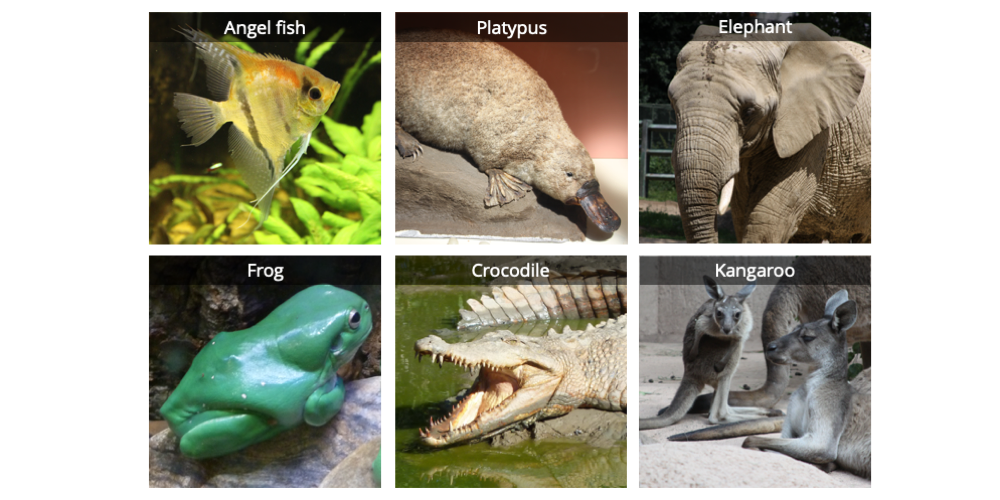
Six vertebrates: an angel fish, a duck-billed platypus, an elephant, a frog, a saltwater crocodile, and a kangaroo. Image by Jonathan R. Hendricks; licensed under a Creative Commons Attribution-ShareAlike 4.0 International License.
Choosing the characters and building the matrix
After the taxa have been chosen, the characters to be analyzed must be selected. Characters may include anatomical/morphological features, developmental and life history traits, chemical characters, proteins, amino acids, DNA sequence data, etc. Broadly speaking, however, most analyses use one of two types of data.
Morphological data
Technically, morphology (from the Greek morphe = form or shape) is the study of form. The phrase "morphological data," however, is often used to encompass a variety of user-delimited characters, such as morphological, anatomical, developmental, and life history data, as well as sometimes chemical characters and other types of data.
In an analysis featuring morphological data (broadly defined), the features of the group of taxa to be analyzed are studied and categorized. Consider the group of six vertebrates (animals with backbones) shown above. What sort of characteristics do they exhibit? While they all have very different overall appearances, some of the animals nevertheless share features in common. For example, all six have internal bony skeletons. Most have four limbs. The platypus, elephant, and kangaroo all have hair and feed their young milk. Except for the fish and the frog, all have amniotic eggs, or eggs featuring a membrane structure called the amnion. The crocodile and platypus lay their eggs on the ground, but the elephant and kangaroo give birth to live young (prior to birth, the fertilized egg develops into an embryo inside the mother). The elephant and kangaroo have external ears (pinna), but the platypus, frog, and crocodile lack this feature. The kangaroo has a pouch, but the other animals do not. You get the idea. For the purposes of this exercise, we may summarize our observations as follows:
Appendages are represented either by fins or by four limbs (legs).
Some vertebrates produce amniote eggs and some do not.
Some vertebrates have hair and some do not (they may have scales or feathers instead).
Some vertebrates have mammary glands and some do not.
Some vertebrates give birth to live young and some lay eggs.
We can then use our observations to define the features as characters and character states. Characters are categories of features, whereas character states are their variations. For example, one way to transform our observations above into characters and character states is to use binary characters. In other words, we can define each character as having two states. Often, these two states reflect the absence or presence of a feature (although this is not required):
Four legs: absent vs. present
Amniote egg: absent vs. present
Hair: absent vs. present
Mammary glands: absent vs. present
Live birth: absent vs. present
Of course, this is not the only way that we could define our characters and states. It is possible to define multistate characters, or characters with more than two states. For example, instead of hair absent/hair present, we could substitute the following character and states:
Body covering: scales vs. feathers vs. hair
Once we have selected our taxa, defined our characters, and divided the characters into states, we can begin the process of "character coding" or "character scoring." In order to score characters, we first have to assign a number to each character state for a given character. Character states are often numbered beginning with the number zero (0). By convention, the state designated as zero typically represents the state that is hypothesized to be ancestral for a given character, which is often the character state found in the outgroup taxon (or taxa, if more than one outgroup has been chosen). For the characters in our list above, we may number the states as follows.
Four legs: absent (0), present (1)
Amniote egg: absent (0), present (1)
Hair: absent (0), present (1)
Mammary glands: absent (0), present (1)
Live birth: absent (0), present (1)
(Note: While the zeroes always correspond to absent in the list above, zero does not have to designate absence.)
For a multistate character, numbering of character states may look something like this:
Body covering: scales (0), feathers (1), hair (2)
Characters and their states are then scored in a character matrix, which is the fundamental dataset for any phylogenetic analysis. A character matrix is simply a table that lists terminal taxa as rows and the characters as columns. Each cell in the matrix is then coded with the character state applicable for each taxon-character combination. Below is an example of a character matrix for our six vertebrate species. Using our taxa and our list of binary characters from above, the character matrix for our group of six vertebrates would look something like the one shown below.
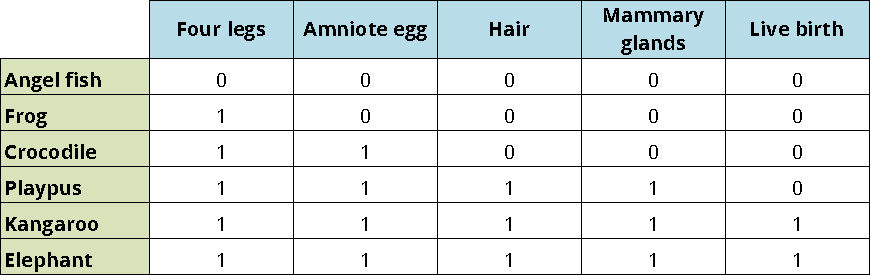
Character matrix for six species of vertebrates coded for five binary characters. Image by Jonathan R. Hendricks; licensed under a Creative Commons Attribution-ShareAlike 4.0 International License.
Note that all characters are scored as zero for the angel fish, which is the outgroup taxon in the character matrix. In addition to providing a root for a phylogenetic tree, the outgroup serves to polarize each character, or to determine which character state is ancestral or "primitive," and which character state is derived or "advanced" (for more on this topic, see the section on character mapping).
The process of building a character matrix is central to the process of phylogeny reconstruction, and it is important for a researcher to have a solid understanding of variability in the morphology of the ingroup prior to beginning the process of character coding. For phylogenetic analyses that focus on morphological characters, defining characters and coding which states apply to which taxa is the most important step, as the coded character data underpin the construction of phylogenetic trees. Coding of morphological features may come from direct study of specimens preserved in natural history collections (e.g., museums or herbaria), or be based on morphological descriptions that have been published in the scholarly literature.
Molecular sequence data
Phylogenetic systematics has its roots in the analysis of morphological character data, but today most phylogenetic analyses focus exclusively or heavily on molecular sequence data, particularly DNA sequences. This type of data is often referred to as "molecular data."
DNA is the genetic code that contains the instructions for building an organism and determines (or, partially determines) many of its characteristics. For example, your eye color, hair color, and blood type are genetically determined; some traits, like adult height, may be determined by a combination of genetic and environmental factors. In eukaryotes, a group that includes animals, plants, fungi, algae, and many other organisms, DNA is found in several parts of the cell. Most DNA is found in a cellular structure called the nucleus, often referred to as the “control center” of the cell. Additional DNA is found in the mitochondrion, a structure involved in cellular respiration. Finally, photosynthetic organisms like plants and algae also have DNA in their chloroplasts (or, more broadly, plastids), which are the structures responsible for photosynthesis. DNA from one or more of these structures may be used in phylogenetic studies.
In order for researchers to "read" DNA sequences, DNA must first be extracted (removed) from the cells of organisms representing the taxa to be included in a study. Selected regions of the DNA are then amplified (copied) and read. The output is a series of letters (A, G, C, and T) representing the nucleotides (adenine, guanine, cytosine, and thymine) that make up a DNA sequence. The sequences read from different organisms must then be aligned. When sequences are aligned, the same position in the sequence representing each taxon is placed in the same column in the character matrix. Thus, the characters in such a dataset are the positions of the nucleotides in a DNA sequence. The letters representing the nucleotides are the character states for each character (they are multistate characters). In an analysis using DNA sequence data, the characters may simply be numbered but not named.
A genome represents all the DNA in a cell. Although sequencing technology is rapidly evolving and sequencing large portions of genomes or even whole genomes is becoming more feasible, typically one or more smaller regions of DNA are selected for sequencing in a molecular phylogenetic analysis. Considerations of which sequences to sample may include a wide variety of factors, such as time, funding, scope of the project, and the taxa under study (different regions are typically used for different groups and at different taxonomic scales). When DNA is sequenced from an organism for a study, the sequence is uploaded into an online repository such as GenBank. Thus, researchers may utilize sequences from prior studies, reducing the amount of work they must do in order to build a molecular sequence matrix for new studies.
Molecules vs. Morphology: Which is Better?
Character sampling presents challenges for morphological datasets. Material preserved in museum collections that may be consulted to build matrices or material preserved as fossils may only represent certain aspects of an organism's morphology. For example, many museum collections of mollusks like snails and clams only feature the shells of these animals, but not the soft-part anatomy, which may be very important for elucidating relationships. Similarly, the published literature on a given group might focus in detail on some aspects of morphology, but not others. Finally, some groups might be character-limited relative to their biodiversity. A general "rule of thumb" is that--in order to attain well-resolved phylogenetic trees--one needs twice as many coded characters as there are ingroup taxa. This presents great challenges for understanding the relationships of species that belong to diverse groups, but are morphologically conservative (in other words, don't vary much in form). Other factors, such as morphological convergence (in other words, similarity in form in unrelated taxa), can also confound morphological datasets, as they may falsely indicate relatedness amongst unrelated taxa.
Relative to morphological data, molecular sequence data have the advantage of providing lots of characters for an analysis. They may thus be easier to utilize or more suitable when trying to determine the relationships amongst taxa with very similar forms, which thus provide few variable characters for morphological analyses. They may also be superior when analyzing relationships amongst organisms with very different forms. It would be very difficult, for example, to build a morphological matrix that includes both mushrooms and clams, as there are no obvious morphological characters that could be coded for both. Two very distantly related and morphologically distinct organisms, however, may nevertheless share regions of DNA that can be compared. In fact, one of the most surprising discoveries of modern biology is that some regions of the DNA codes of organisms are highly conserved, meaning that even distantly related organisms share DNA regions in common, with only subtle differences separating very different groups. Sequence data may also be seen as more objective than morphological datasets, since the delineation of morphological characters and states is more strongly influenced by the interpretations of individual investigators.
An advantage of morphological over molecular data is that morphological characters can be coded for long-extinct species known only from the fossil record. Such morphological characters are usually limited, however, to particular kinds of features that are most likely to be preserved as fossils (e.g., the hard, mineralized parts such as bones or shells; see Nature of the Fossil Record chapter). Even so, DNA sequence data have been recovered and utilized to determine the relationships of organisms that are relatively recently extinct. Some such organisms have undergone extinction in historic times, such the dodo and Stellar’s sea cow, although prehistoric organisms such as cave bears, Neanderthals, and woolly mammoths, have also yielded DNA sequences of a quality that could be included in a phylogenetic analysis. While popular culture has perhaps excited the possibility that ancient DNA can be recovered from certain types of fossils (e.g., amber) studies suggest that DNA is subject to relatively rapid degradation and may not survive long, even in ideal conditions for preservation. Thus, DNA sequences are not and will not be available for the overwhelming majority of extinct organisms, which is a weakness of this type of data.
It is possible combine molecular and morphological data in the same character matrix, which allows fossil taxa to be analyzed together with extant organisms. In this type of "total evidence" analysis, fossil taxa and extant taxa are coded for the same morphological characters. Often, because of incomplete preservation, many morphological characters are missing in fossil taxa and are coded with question marks (?'s), which causes them to be treated as having any possible state for a given character. The molecular portion of the total evidence dataset (or, molecular partition) may be coded only for the extant taxa. So long as key morphological characters are preserved in fossil taxa, it is often possible to use a total evidence approach to reconstruct their phylogenetic positions with reasonable precision.
Morphological Matrix Example
Actual morphological data matrices are much more complex than the simple example used above. Below you will find an example of a morphological character matrix recently employed by Bauer et al. (2017; Journal of Paleontology) to investigate the phylogenetic relationships of blastoids, a strange—if lovely—group of extinct echinoderms.
Fossil specimen of the blastoid Pentremites godani from the Mississippian Paint Creek Formation of St. Clair County, Illinois (PRI 70771). Specimen is from the collections of the Paleontological Research Institution, Ithaca, New York. Specimen is approximately 2 cm in length.
Descriptions of the characters and their states follow the table. Data downloaded from Dryad (CC0 license).
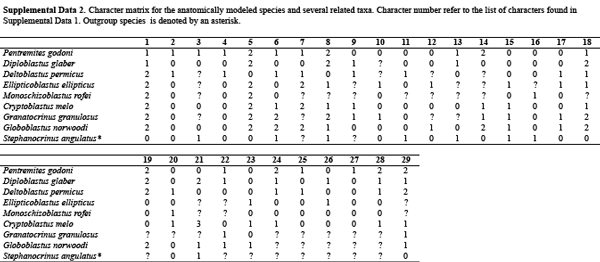
Blastoid morphological character matrix from published research paper by Bauer et al. (2017). Data downloaded from Dryad (CC0 license).
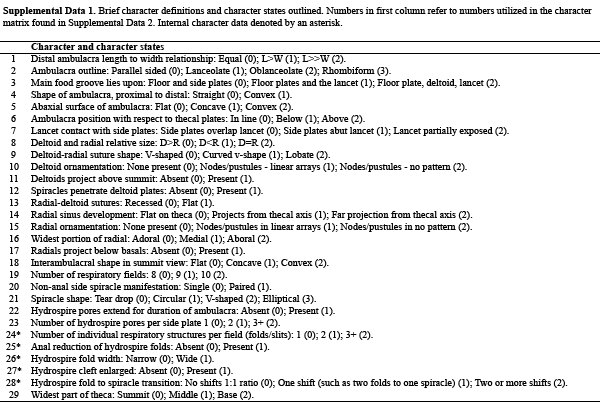
Blastoid character descriptions from published research paper by Bauer et al. (2017). Data downloaded from Dryad (CC0 license).
From matrix to tree
Recall that a phylogenetic tree is a branching diagram that shows relationships among taxa. One could draw a tree showing a hypothesis of relationships amongst a set of taxa based on one's opinion and nothing else. For example, given the taxa above, we could draw a number of different trees showing their possible relationships. In fact, for a group of six taxa, with one designated as the outgroup, there are 945 possible tree topologies that one could draw to represent their relationships. Even so, many of these trees would seem silly or preposterous. Using the taxa from our example above, a tree in which the elephant and the crocodile are most closely related to another is obviously incorrect, given our background knowledge of the anatomy and life cycles of these particular taxa. Similarly, a tree in which the frog is shown to be most closely related to the kangaroo would seem ridiculous.
That said, many groups of taxa will have relationships that are not so easy to assess. What if we were comparing species within a single genus of plants? Or fungi spanning the entire fungal kingdom? Or even a tree of animal relationships with many more animals on it. Which is more closely related to a whale: a seal or a hippo? How do you decide? This problem only gets more complex when more taxa are added to a matrix: as the number of terminal taxa increases linearly in a matrix, the number of possible tree diagrams that could be drawn to represent their relationships increases exponentially. Thus, while there are 945 possible rooted trees (in other words, trees with a given outgroup) that represent the relationships among six taxa, there are 10,395 possible rooted trees that represent relationships among seven taxa! (As an aside, there are an estimated 1082 atoms in the universe. As demonstrated in the table below, the number of possible trees for a phylogenetic analysis that includes 60 taxa greatly exceeds this value.)
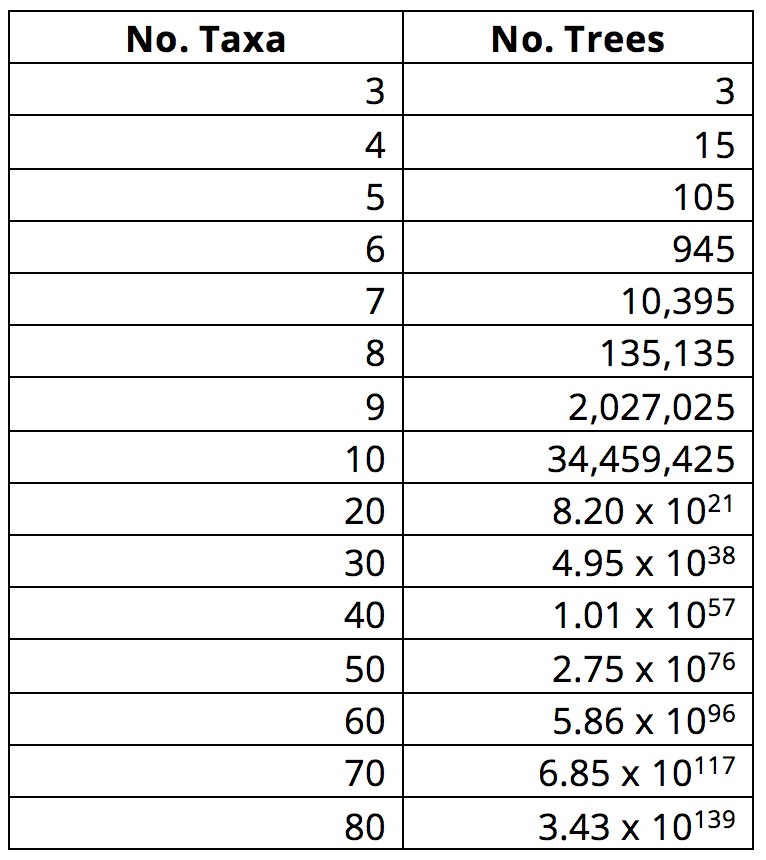
As the number of taxa included in an analysis increases, so does the number of possible tree topologies. Image by Jonathan R. Hendricks; licensed under a Creative Commons Attribution-ShareAlike 4.0 International License.
Today, systematists strive to reconstruct relationships among taxa using methods that are objective and repeatable. In order to do so, they apply a set of rules to a character matrix in order to decide which tree diagram out of the universe of many possible tree diagrams best represents the relationships amongst a selected group of taxa.
One of simplest ways to decide amongst possible trees is using a method known as parsimony. In parsimony, the shortest tree is considered the best representation of relationships amongst taxa. This approach follows the philosophical principle of Occam's razor: all other factors being equal, simple answers are preferred over those that are more complex. The shortest tree is also known as the most parsimonious tree. In the simplest type of parsimony, each character state change on a tree is equivalent to a single step on that tree. Using our example above, a change from hair absent to hair present would be one step. Thus, an investigator will seek a tree that minimizes the number of steps.
Other popular ways of building trees include maximum likelihood and Bayesian analyses. In these types of analyses, investigators incorporate evolutionary models in order to decide which tree is statistically most likely (in maximum likelihood) or which tree has the highest posterior probability (Bayesian analyses). These methods are used frequently for analyzing DNA sequence data (where certain mutations in the DNA code are more likely than others), whereas parsimony is a method often preferred for morphological characteristics, whose evolution is more difficult to model.
Although computing power is always increasing, we are still unable to build and compare all possible trees when analyzing more than a very small number of taxa. Thus, computer algorithms utilize shortcuts to attempt to hone in on optimal trees and discard suboptimal solutions as efficiently as possible, while also sufficiently sampling tree space (in other words, sufficiently sampling the universe of possible tree diagrams for a given set of taxa).
Trees as hypotheses
Because no evidence suggests otherwise, biologists and paleontologists assume that all species alive on Earth today share a single common ancestor that lived several billion years ago. As a consequence, all organisms share an evolutionary history that--at least in theory--could be represented by a single phylogenetic tree ("the true tree"). All phylogenetic analyses seek to approximate portions of this tree. Because most species that have ever lived are now extinct, however, phylogenetic sampling of taxa and their characters will always be incomplete, most especially because many extinct species left behind no fossil record. Therefore, regardless of the type(s) of data and methodology used to construct a phylogenetic tree, it is important to always keep in mind that the resulting tree is a hypothesis.
How then can we know when we have come close to approximating "the true tree"? Consilience among data sources presents a strong case that a phylogenetic hypothesis is robust. For example, if analysis of a given morphological dataset results in the same tree as a completely independent molecular sequence dataset, a strong case could be made that the tree is correctly approximating a portion of the true tree. A similar case could be made for independent gene sequences that present the same branching topologies. A given topology might also be considered robust if the addition of more characters and taxa does not substantially change patterns of relationships within the tree (e.g., major branches are not overturned). Finally, biologists have developed a variety of statistical approaches to assign "support values" to individual nodes on phylogenetic trees (bootstrap values are just one example) to provide an indicator of their relative reliability.
Review
Question
In a parsimony analysis, which discovered tree topologies are favored?
Answer
The tree(s) with the fewest character changes (fewest steps) are preferred.
Question
In order to attain phylogenetic resolution in an analysis of 20 taxa, how many characters should be scored?
Answer
Approximately twice as many characters as ingroup taxa need to be scored. So, if there are 20 ingroup taxa, at least 40 characters should be scored.
Question
In a phylogenetic study, what is the ingroup?
Answer
The ingroup is the collection of taxa whose relationships are under study in a phylogenetic analysis.
Question
What is one major advantage that morphological character data have over molecular sequence data?
Answer
They can be coded for extinct species. It is generally not possible to extract useful molecular sequence data from fossil specimens.
Question
What is one major advantage that molecular sequence character data have over morphological data?
Answer
They are much more numerous, allowing analyses of large numbers of ingroup taxa. One drawback, however, is that they typically cannot be collected from the remains of extinct organisms.
References and further reading
Bauer, J. E. , C. D. Sumrall, and J. A. Waters. 2017. Hydrospire morphology and implications for blastoid phylogeny. Journal of Paleontology 91(4): 847-857. Link.
Hermsen, E. J. and J. R. Hendricks. 2008. W(h)ither fossils? Studying morphological character evolution in the age of molecular sequences. Annals of the Missouri Botanical Garden 95(1): 72-100. Link. This paper describes the total evidence approach and the value of including fossils in phylogenetic analyses of extant taxa.
Content usage
Usage of text and images created for DEAL: Text on this page was written by Elizabeth J. Hermsen and Jonathan R. Hendricks. Original written content created by Elizabeth J. Hermsen and Jonathan R. Hendricks for the Digital Encyclopedia of Ancient Life that appears on this page is licensed under a Creative Commons Attribution-NonCommercial-ShareAlike 4.0 International License. Original images created by Jonathan R. Hendricks are also licensed under Creative Commons Attribution-NonCommercial-ShareAlike 4.0 International License.
Content sourced from other websites: Attribution, source webpage, and licensing information or terms of use are indicated for images sourced from other websites in the figure caption below the relevant image. See original sources for further details. Attribution and source webpage are indicated for embedded videos. See original sources for terms of use. Reproduction of an image or video on this page does not imply endorsement by the author, creator, source website, publisher, and/or copyright holder.