
Chapter contents:
Systematics
— 1. Taxonomy
— 2. Phylogenetics
—— 2.1 Reading trees
—— 2.2 Building trees
—— 2.3 Character mapping ←
—— 2.4 Phylogenetic trees and classification
Overview
Phylogenetic trees may be used to investigate the sequence and timing of origination of particular features of organisms, as well as the distributions of those features among different groups of species. Some or all of these changes may be mapped on a tree, a procedure called character mapping. A character state change is mapped between the ancestor (node) the has one state, and the descendent (node or terminal taxon) that has another state. Typically, a character state change is indicated by a hash mark (horizontal line) or another sort of mark (like a dot) placed on a brach; each mark may then be labelled with a number corresponding to a character, a description of the character, or a description of the new character state. Sometimes, character state changes may be indicated in other ways (for example, a change in the color of a branch). Characters that change along the same branch can be mapped in any order. The order of the characters mapped on a branch does not indicate the order in which they changed from one state to another. Viewed in the context of a phylogenetic tree, mapped characters can be used to evaluate which features define different clades (i.e., monophyletic groups; see Sec. 4.2.4), which features are ancestral, which provide no grouping information at all, and which arose multiple times. It is also possible to use character mapping in combination with analytical approaches to reconstruct the individual characters present in common ancestors, which are represented by nodes on phylogenetic trees.
Apomorphies, Synapomorphies, and Plesiomorphies
An apomorphy is a derived (sometimes called "advanced") feature. The system of phylogenetic reconstruction developed by Willi Hennig (parsimony) groups organisms according to their possession of shared derived character states, which he called synapomorphies. In other words, a feature is considered to be useful for phylogenetically grouping two or more species if that same feature was also present in the shared common ancestor of the species, but not present in more distantly related taxa. Suppose your ingroup included two birds and a crocodile. Feathers are a synapomorphy that unites the two bird species, separating them from the crocodile. Thus, synapomorphies represent shared evolutionary novelty, distinguishing clades from their ancestors.
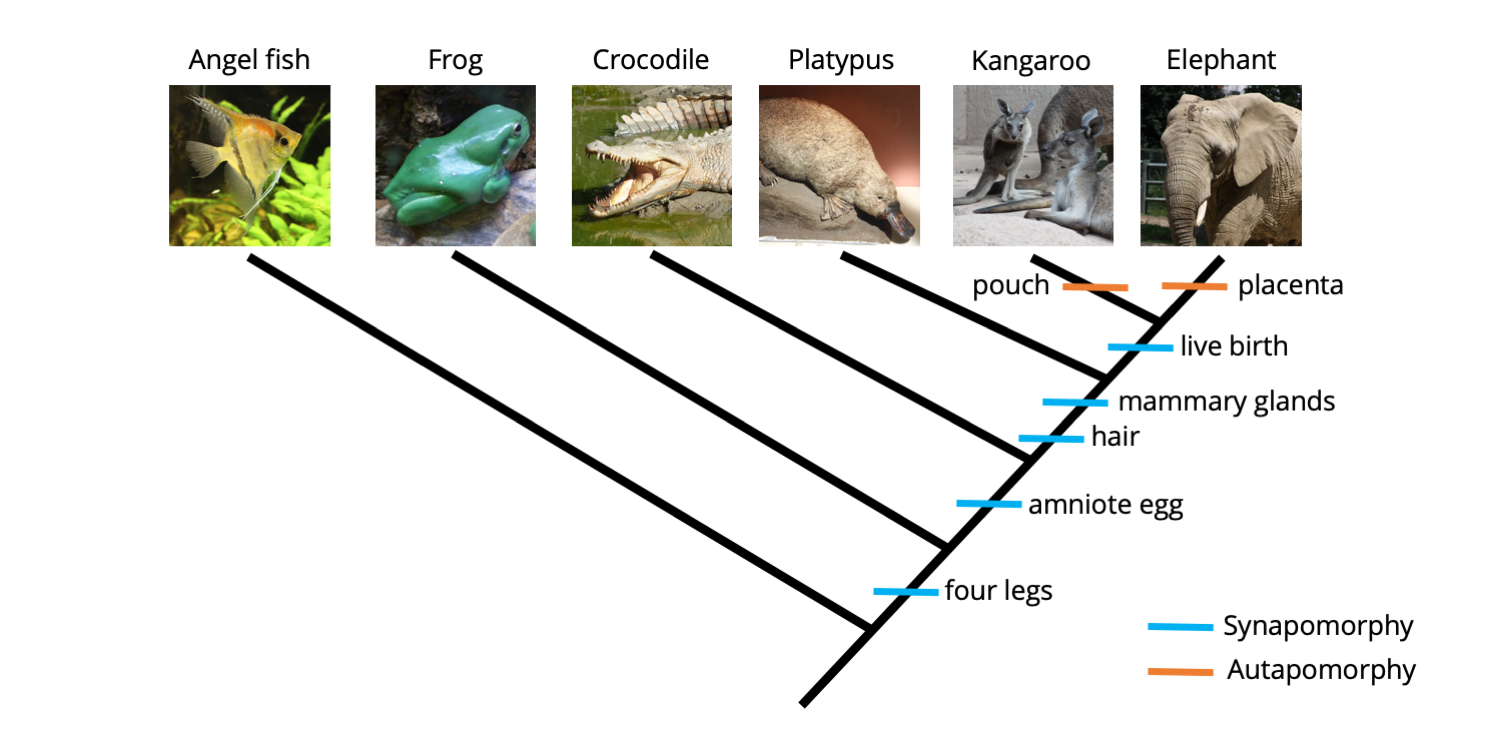
The phylogenetic tree below summarizes relationships among the five ingroup species we considered earlier (Sec. 4.2.2: Building trees). Synapomorphies are mapped below each node and are indicated by blue hashmarks; in fact, the synapomorphy identified below each node provides the basis (and computational support) for that node. The character state name to the right of each hashmark indicates the derived condition of the character, or derived character state. For example, "four legs" can be read in this case as "four legs present" and "hair" can be read as "hair present."
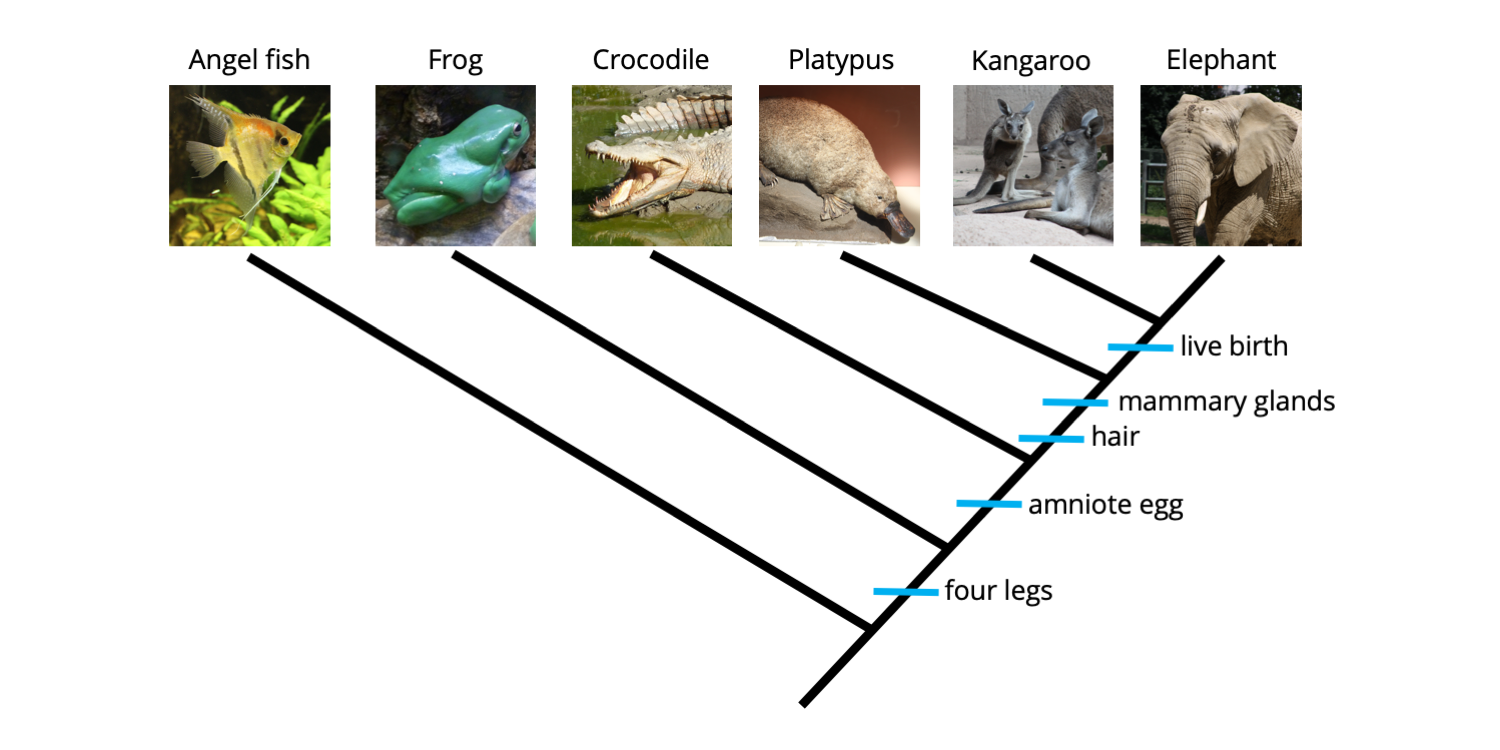
A phylogenetic tree depicting relationships between five ingroup species (a frog, crocodile, platypus, kangaroo, and elephant) and one outgroup species (an angel fish). Synapomorphies are labeled using hashmarks just below each of the nodes that they support. Image by Jonathan R. Hendricks is licensed under a Creative Commons Attribution-ShareAlike 4.0 International License.
Synapomorphies are hierarchically nested on phylogenetic trees. For example, the frog, crocodile, platypus, kangaroo, and elephant all have four legs. This is indicated on the phylogenetic tree by the hashmark labeled "four legs" just below the node representing the common ancestor of these five species (this common ancestor possessed four legs). The platypus, kangaroo, and elephant all have hair and mammary glands, but also the derived features that appeared earlier in the history of the ingroup (i.e., four legs and amniotic eggs). Note, however, that we do not have enough information to determine whether hair originated before or after mammary glands, despite their order of depiction on the tree. Finally, the kangaroo and elephant both give birth to live young, a characteristic absent in all of the other species, which lay eggs. The kangaroo and elephant, of course, also posses all of the features exhibited by the more basal taxa (i.e., those with fewer synapomorphies that are connected to deeper nodes on the tree), including four legs, amniotic eggs (which develop internally), hair, and mammary glands. Because they have more synapomorphies and are connected to shallower nodes on the tree, the kangaroo and elephant are said to be derived taxa.
Contrast synapomorphies with plesiomorphies, which are ancestral features (sometimes called primitive features) that do not provide grouping information. Suppose your ingroup included a lion, a tiger, and a bear (oh my!). If hair were used as a character in such a study, it would be a plesiomorphy because all three animals have the feature, which is universal among mammals. The presence of hair alone does not tell us whether a lion is more closely related to a tiger or to a bear, although a variety of other features (synapomorphies) do indeed separate the two large cats from the bear.
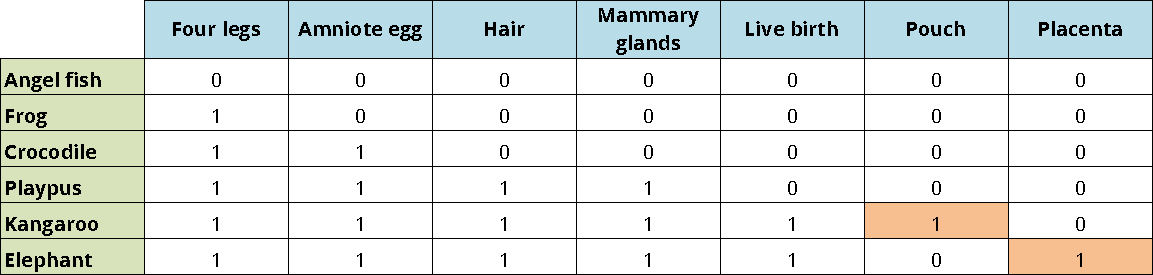
The examples above of synapomorphies and plesiomorphies are highly simplistic. If you were to conduct a phylogenetic study of all tetrapods (four-limbed vertebrates), how would you know whether the presence of feathers or hair is a derived feature (an apomorphy) or an ancestral feature (a plesiomorphy)? The answer is to include an outgroup taxon (or multiple outgroup taxa) in your analysis. For the purposes of tree construction, the features of the outgroup are, by definition, plesiomorphic. In the example above, the outgroup taxon--the angel fish--possesses only the plesiomorphic condition for each character: it lacks legs, amniotic eggs, hair, mammary glands, and live birth, as indicated in the taxon-character matrix below.
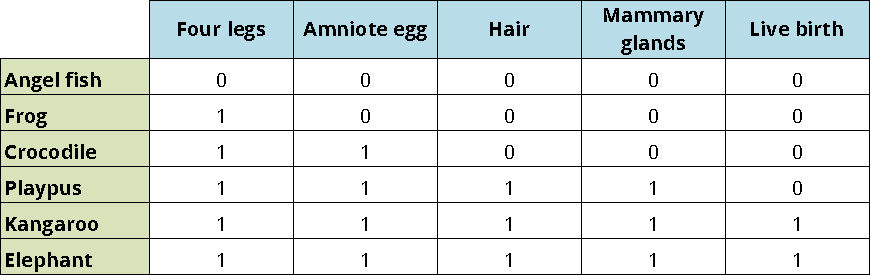
Character matrix for six species of vertebrates coded for five binary characters. The angel fish is the outgroup taxon, which has—by definition—the primitive, plesiomorphic states for each character. Image by Jonathan R. Hendricks is licensed under a Creative Commons Attribution-ShareAlike 4.0 International License.
Including an outgroup taxon in an analysis serves to polarize character states (i.e., determine which character states are plesiomorphic and which are apomorphic) and to root the tree (i.e., to designate where the base of the tree is located). If an ingroup taxon possesses the same character state as the outgroup (e.g., hair absent), it has the plesiomorphic condition for that character state. If it instead has a different state for a given character relative to the outgroup, it has the apomorphic (derived) condition for that state. Because the angelfish is is the outgroup in our analysis—and therefore roots the tree—it is attached to the deepest node, as shown in the tree above.
Autapomorphies
Synapomorphies and autapomorphies are both types of apomorphies, or derived characters; the difference between them is whether they are shared among taxa (synapomorphies) or not (autapomorphies). Autapomorphies are present in only one of the terminal taxa included in an analysis. Because they are unique, autapomorphies do not provide any useful grouping information. Continuing from above, suppose that two additional characters were added to our analysis: a pouch and a placenta.
Matrix for ingroup and outgroup taxa with two additional characters added: pouch and placenta. These two characters are each present in only one taxon, making them autapomorphies (shaded in orange). Image by Jonathan R. Hendricks is licensed under a Creative Commons Attribution-ShareAlike 4.0 International License.
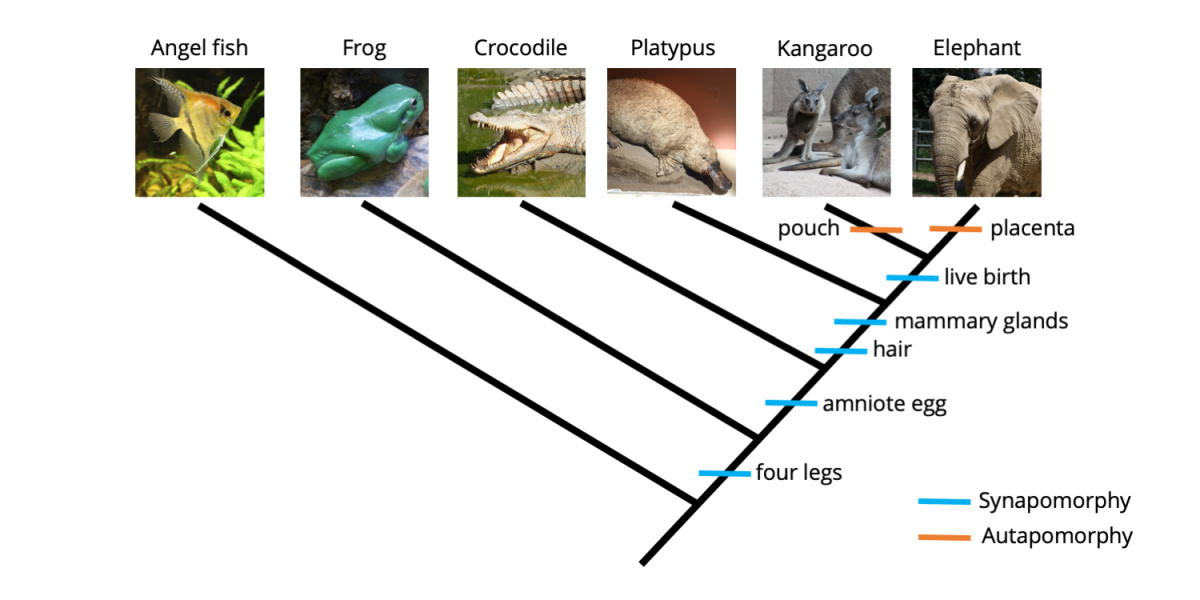
As you can see from the matrix above, the only animal in our analysis that has a pouch is the kangaroo (juvenile kangaroos are born prematurely, crawl into their mother's pouch immediately after birth, and continue their development inside). Further, the only animal that features a placenta is the elephant (the placenta connects the mother elephant to the offspring developing inside her body). The phylogenetic tree below shows these two autapomorphic characters mapped on the tree.
Two additional character states, presence of a pouch and presence of a placenta, have been mapped onto the tree. Neither provides grouping information (because each is present in only one species), so are both autapomorphies. Image by Jonathan R. Hendricks is licensed under a Creative Commons Attribution-ShareAlike 4.0 International License.
Adding additional taxa to an analysis, however, can sometimes turn autapomorphic characters into synapomorphies. Let's consider the effects of adding a koala and gorilla to our analysis.
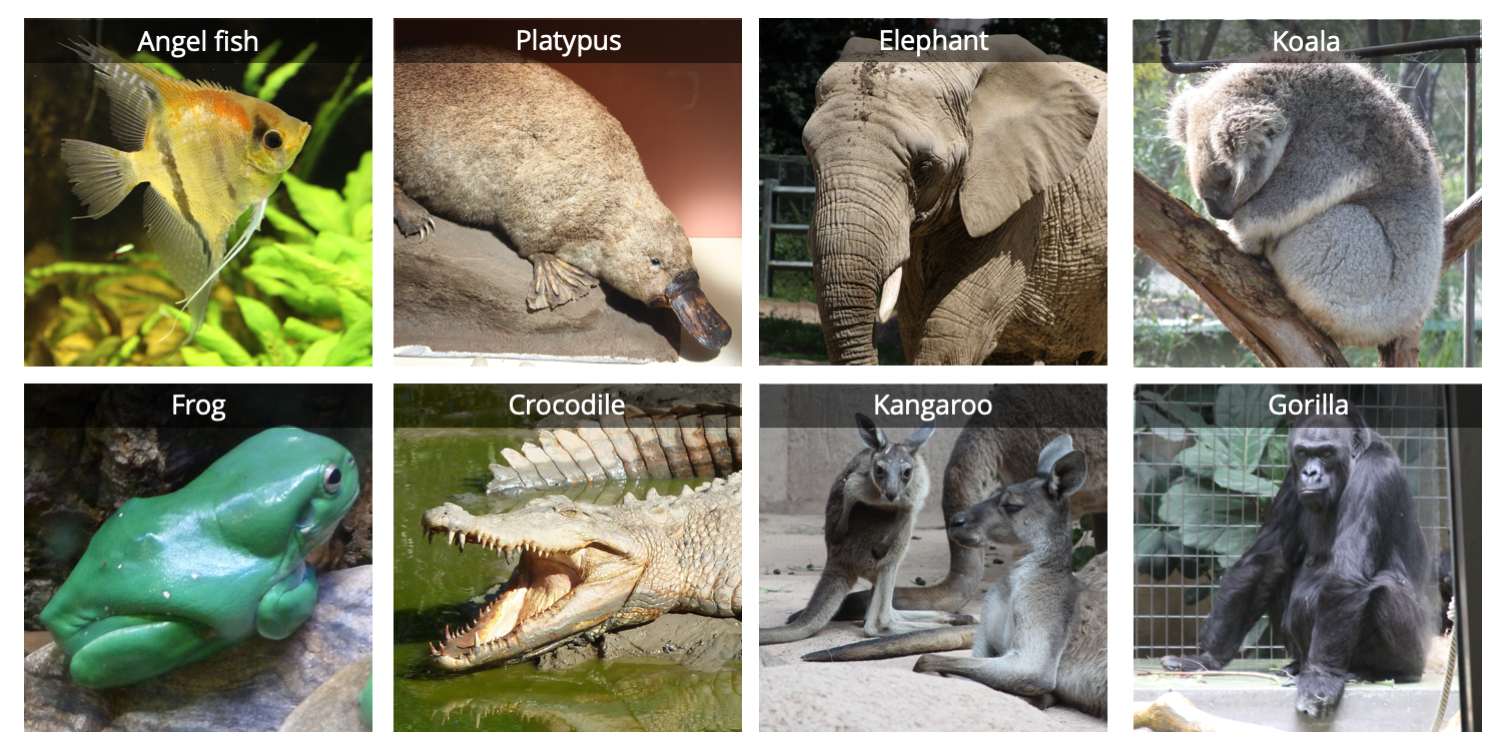
One outgroup (angel fish) and seven ingroup taxa. The addition of the koala and gorilla transform the pouch and placenta characters from autapomorphies to synapomorphies. Image by Jonathan R. Hendricks is licensed under a Creative Commons Attribution-ShareAlike 4.0 International License.
Like kangaroos, koalas also bear (har!) a pouch, which is a universal feature of female marsupials. Further, mother gorillas are connected to their developing young via a placenta, just like the elephant. Adding these two taxa to our analysis results in the following matrix.
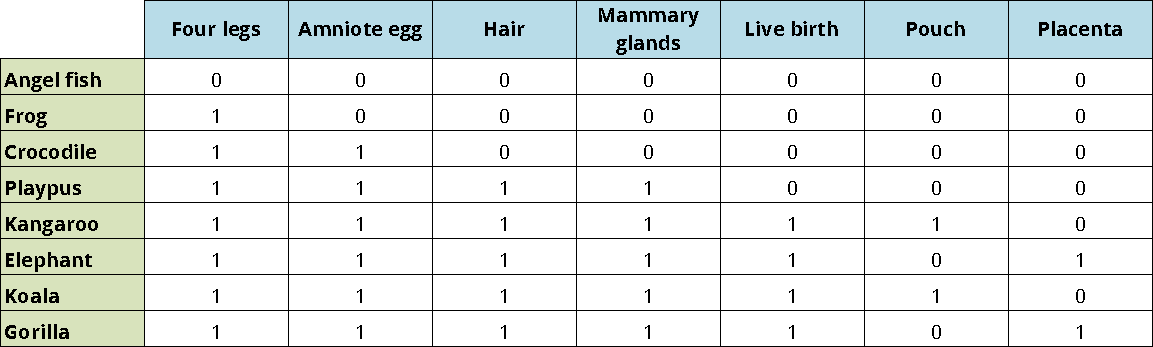
Matrix for ingroup and outgroup taxa with two additional animals added: a koala and gorilla. The addition of these two animals transform the pouch and placenta characters from autapomorphies into synapomorphies. Image by Jonathan R. Hendricks is licensed under a Creative Commons Attribution-ShareAlike 4.0 International License.
Now, the presence of a pouch is shared by both the kangaroo and the koala, transforming the character from an autapomorphy into a synapomorphy and providing information that suggests a close relationship between the kangaroo and the koala. The same is true for the placenta, which now unites the elephant and gorilla relative to the other animals. A revised phylogenetic tree is shown below.
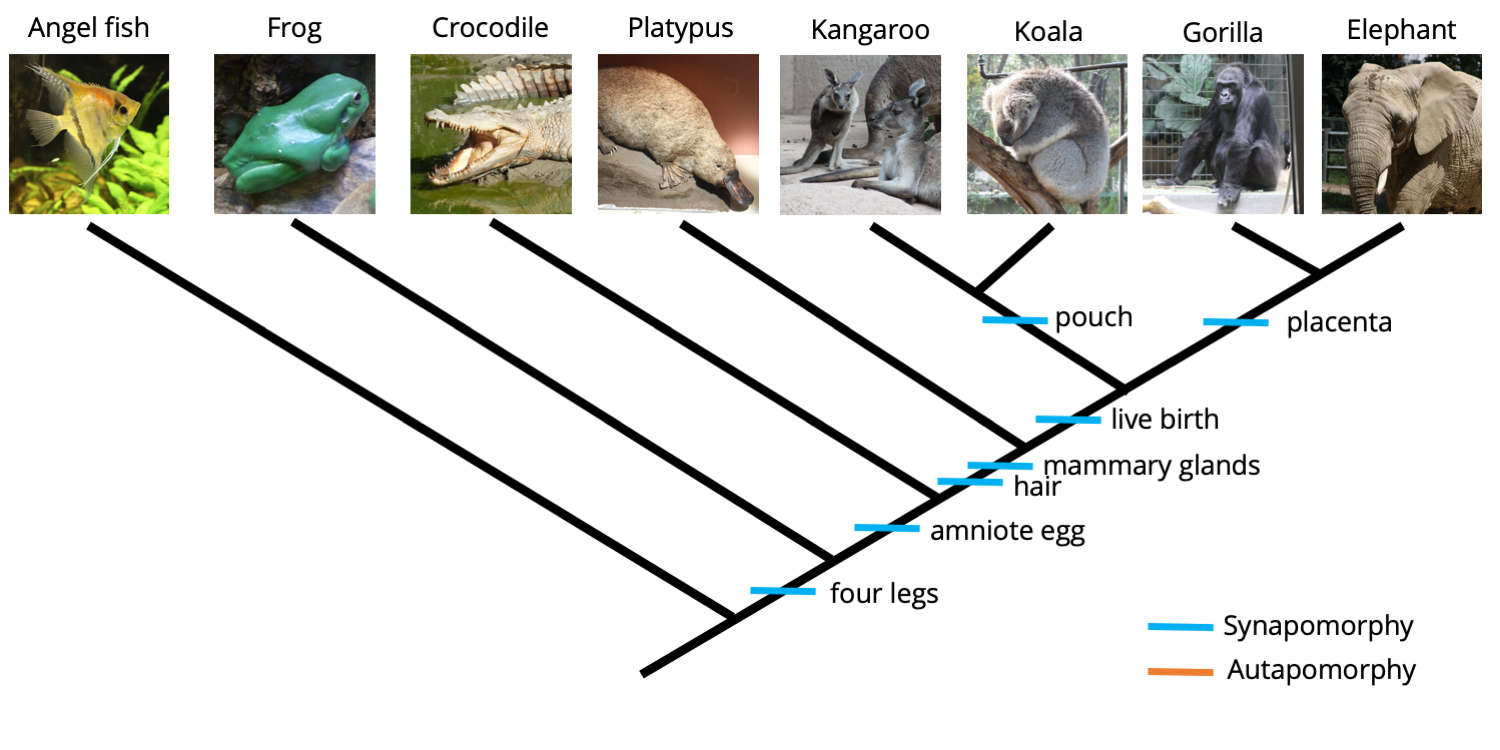
A koala and gorilla have been added to the ingroup, causing the "pouch present" and "placenta present" character states to transform from autapomorphies to synapomorphies. Image by Jonathan R. Hendricks is licensed under a Creative Commons Attribution-ShareAlike 4.0 International License.
Homoplasious Characters
Homoplasious characters are characters whose optimal distribution is incongruent with the topology of a given phylogenetic tree. Homoplasy may be a result of evolutionary convergence or reversion to a seemingly ancestral state.
Homoplasious characters can introduce error into phylogenetic studies because it is possible for such characters to provide false grouping information. As an example, suppose you wanted to determine the phylogenetic relationships of a butterfly, hummingbird, bat, bear, and shark. The first three animals all have structures used for flight that we call “wings.” Including the character “wings” in a character matrix might cause these three animals to group together on the resulting phylogenetic tree. This is problematic, because wings evolved independently in the respective ancestors of each of three animals. In other words, the common ancestor shared by the butterfly, the hummingbird, and the bat did not have wings.
One way to avoid such homoplasious characteristics (or, homoplasy) in an analysis is to define the characters more carefully. For example, the wings of the butterfly are completely different from the wings of the hummingbird and bat in terms of their structure and development. In turn, the hummingbird and bat both exhibit very different modifications of the tetrapod forelimb to form the wing. Homoplasy typically cannot be completely avoided in phylogenetic analyses, however, and most real-world datasets include at least a few homoplasious characters.
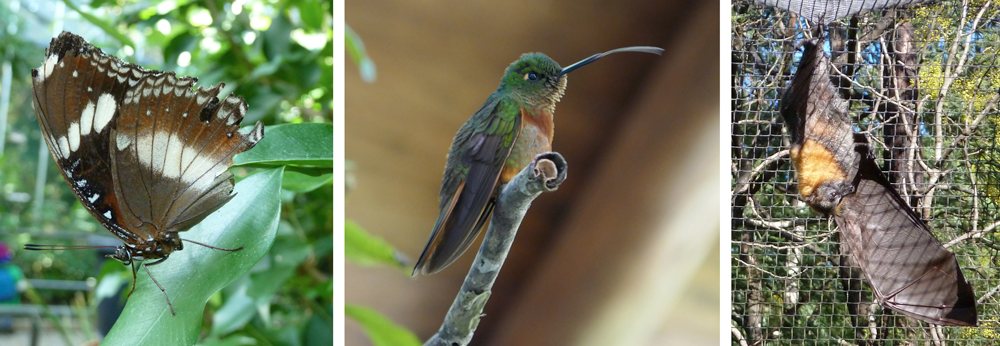
Compare the wing structure of a butterfly (left), hummingbird (center), and bat (right). Image by Jonathan R. Hendricks is licensed under a Creative Commons Attribution-ShareAlike 4.0 International License.
Examples of Character Mapping
Bioluminescence in Marine Fish
Using character mapping, Davis et al. (2016 in PLoS ONE) recently demonstrated that bioluminescence (the ability of organisms to produce their own light) originated independently 27 times in marine fishes. In other words, bioluminescence is a homoplasious character. Note that in this tree, character distributions are indicated using color-coded branches rather than hashmarks.
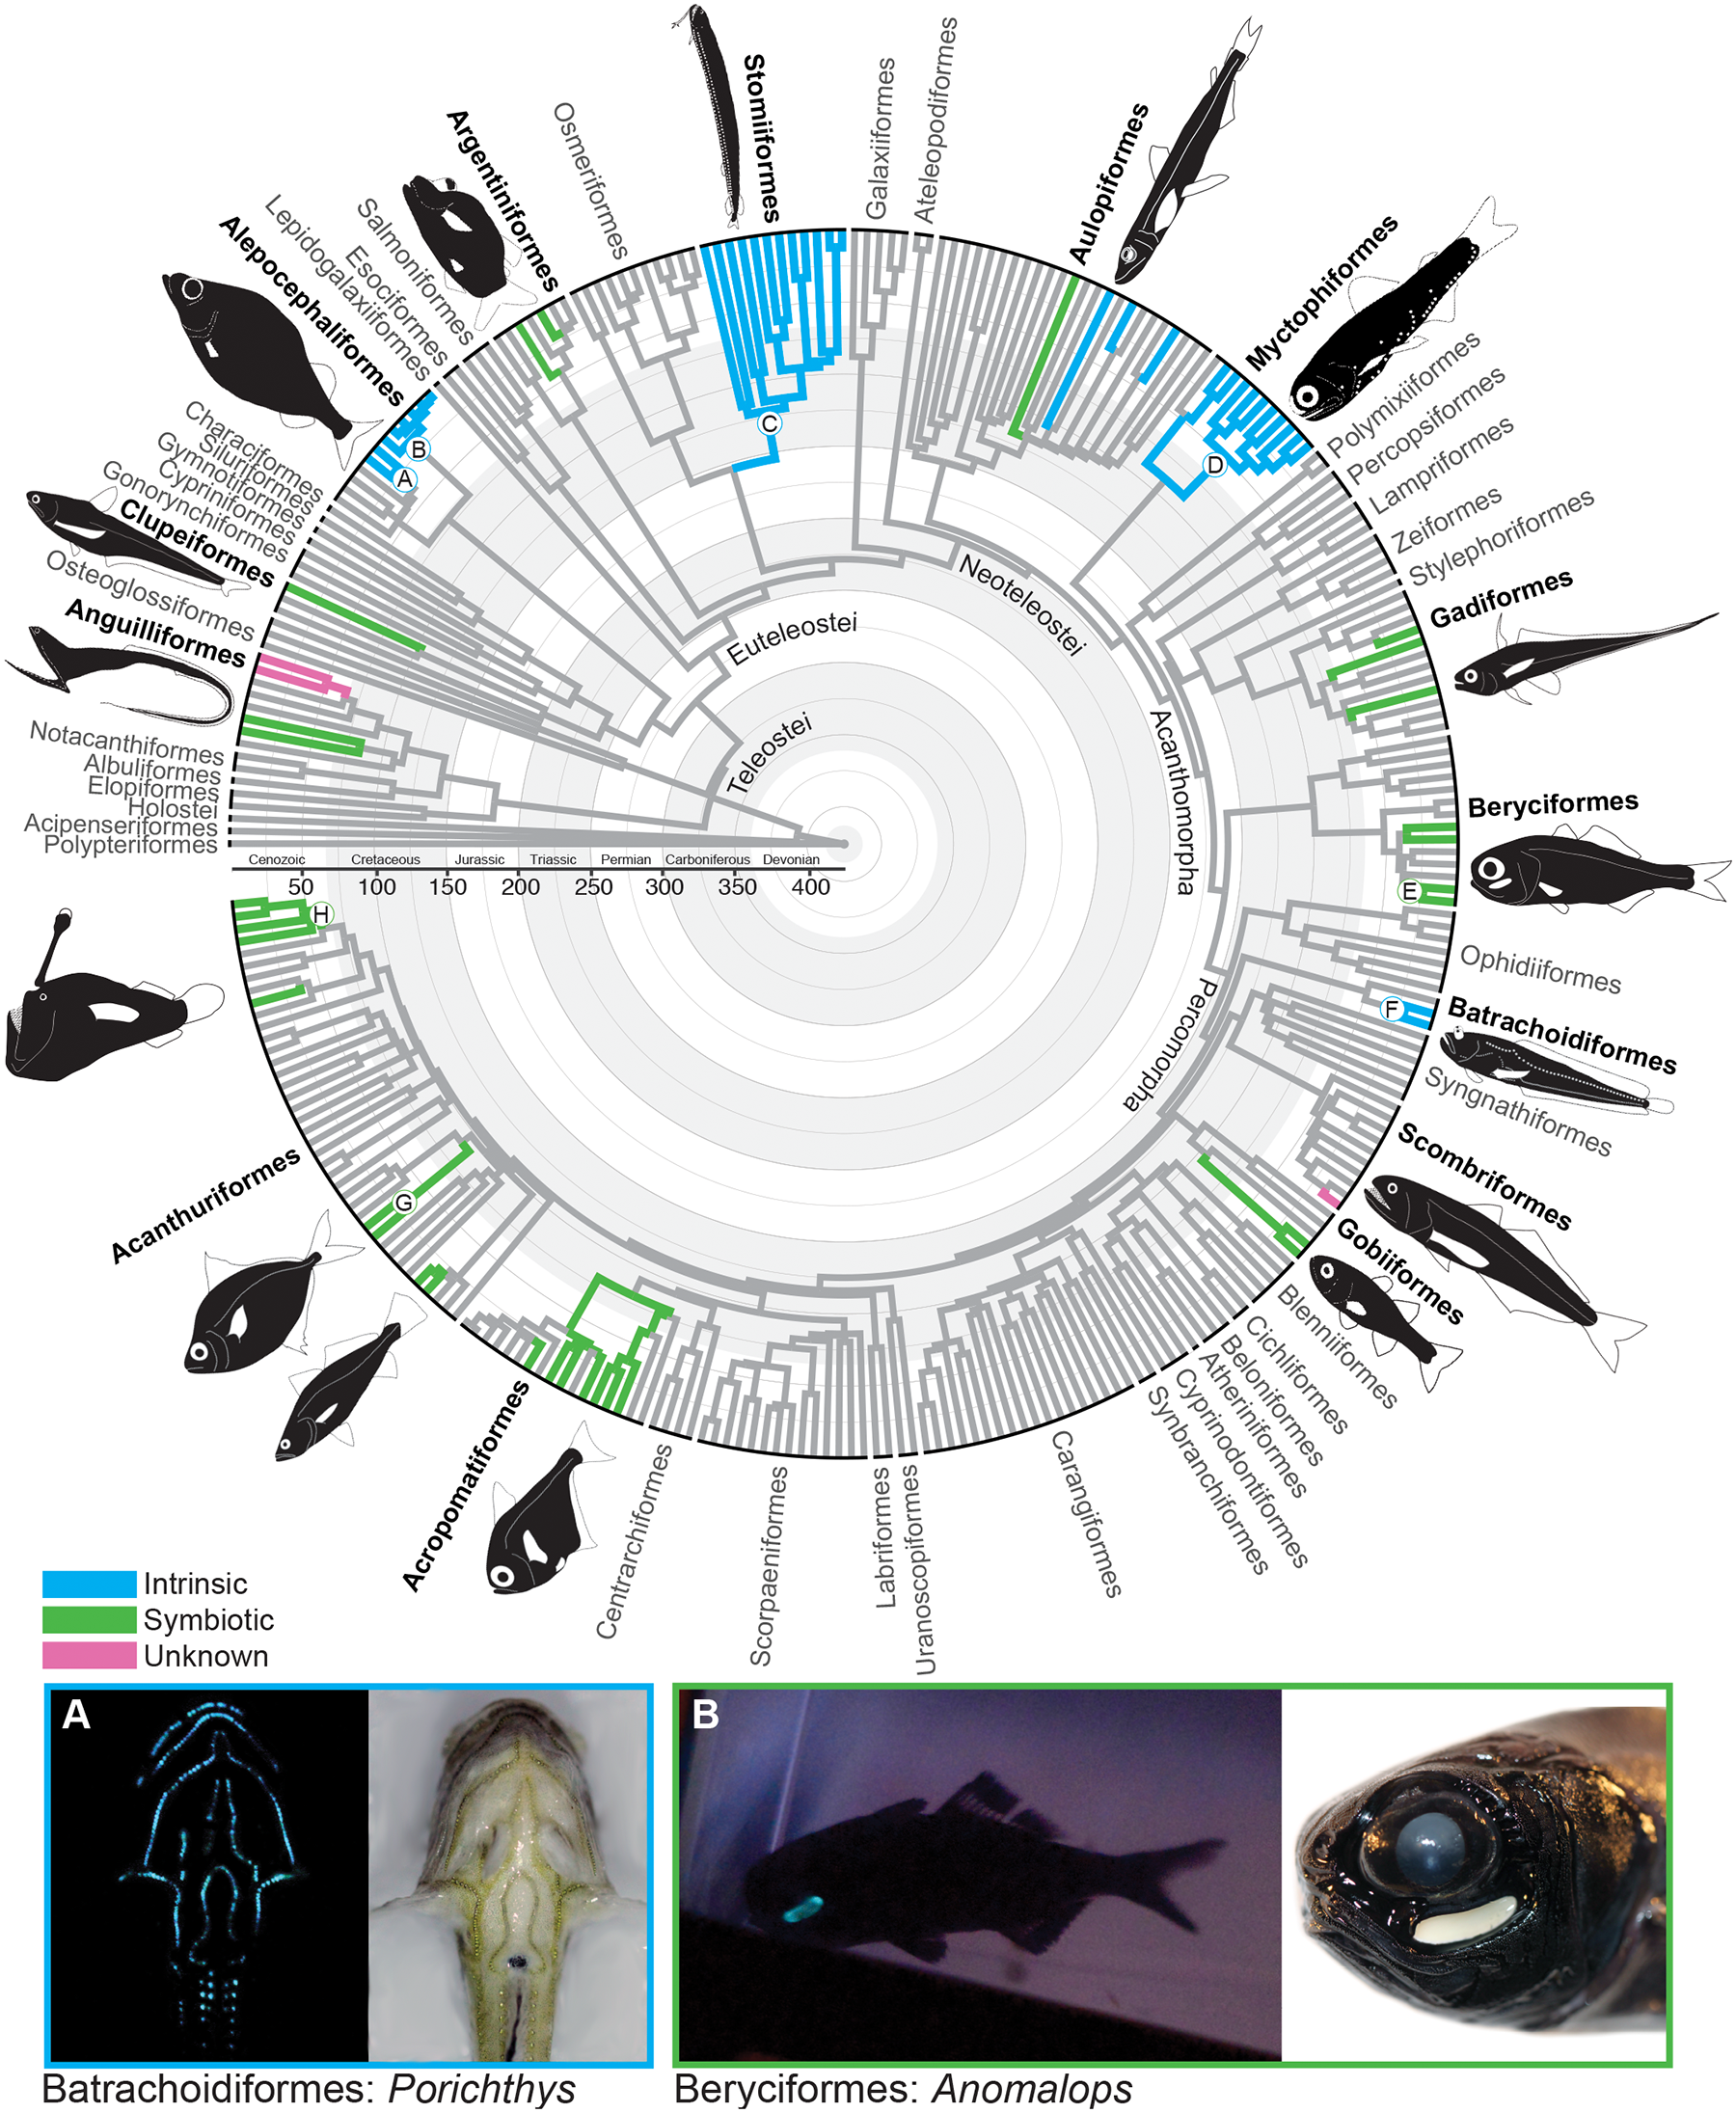
Image is from fig. 1 in Davis et al. (2016) in PLoS ONE. Original caption: "Fig 1. Evolution of Bioluminescence across Ray-Finned Fishes. Evolutionary relationships and divergence times of ray-finned fishes inferred from 11 gene fragments. Letters at nodes correspond to clades indicated in Fig 4. Branch colors indicate the presence of bioluminescence and whether the mechanism of bioluminescence is intrinsic, bacterially mediated, or unknown. Examples of bioluminescent ray-finned fishes include the A: midshipman (Porichthys: intrinsic), and B: flashlight fish (Anomalops: bacterially mediated)." Used in accordance with Creative Commons Attribution 4.0 International (CC BY 4.0) license.
Character Evolution in Coptis
Xiang et al. (2016 in PLoS ONE) recently used molecular sequence data to investigate the phylogeny of Coptis, a genus of plants. They then used this phylogeny to determine how different morphological features evolved in this group. To do this, they mapped different morphological characters onto a phylogenetic tree, then used analytical techniques to reconstruct the characters at the different nodes (an approach called ancestral state reconstruction).
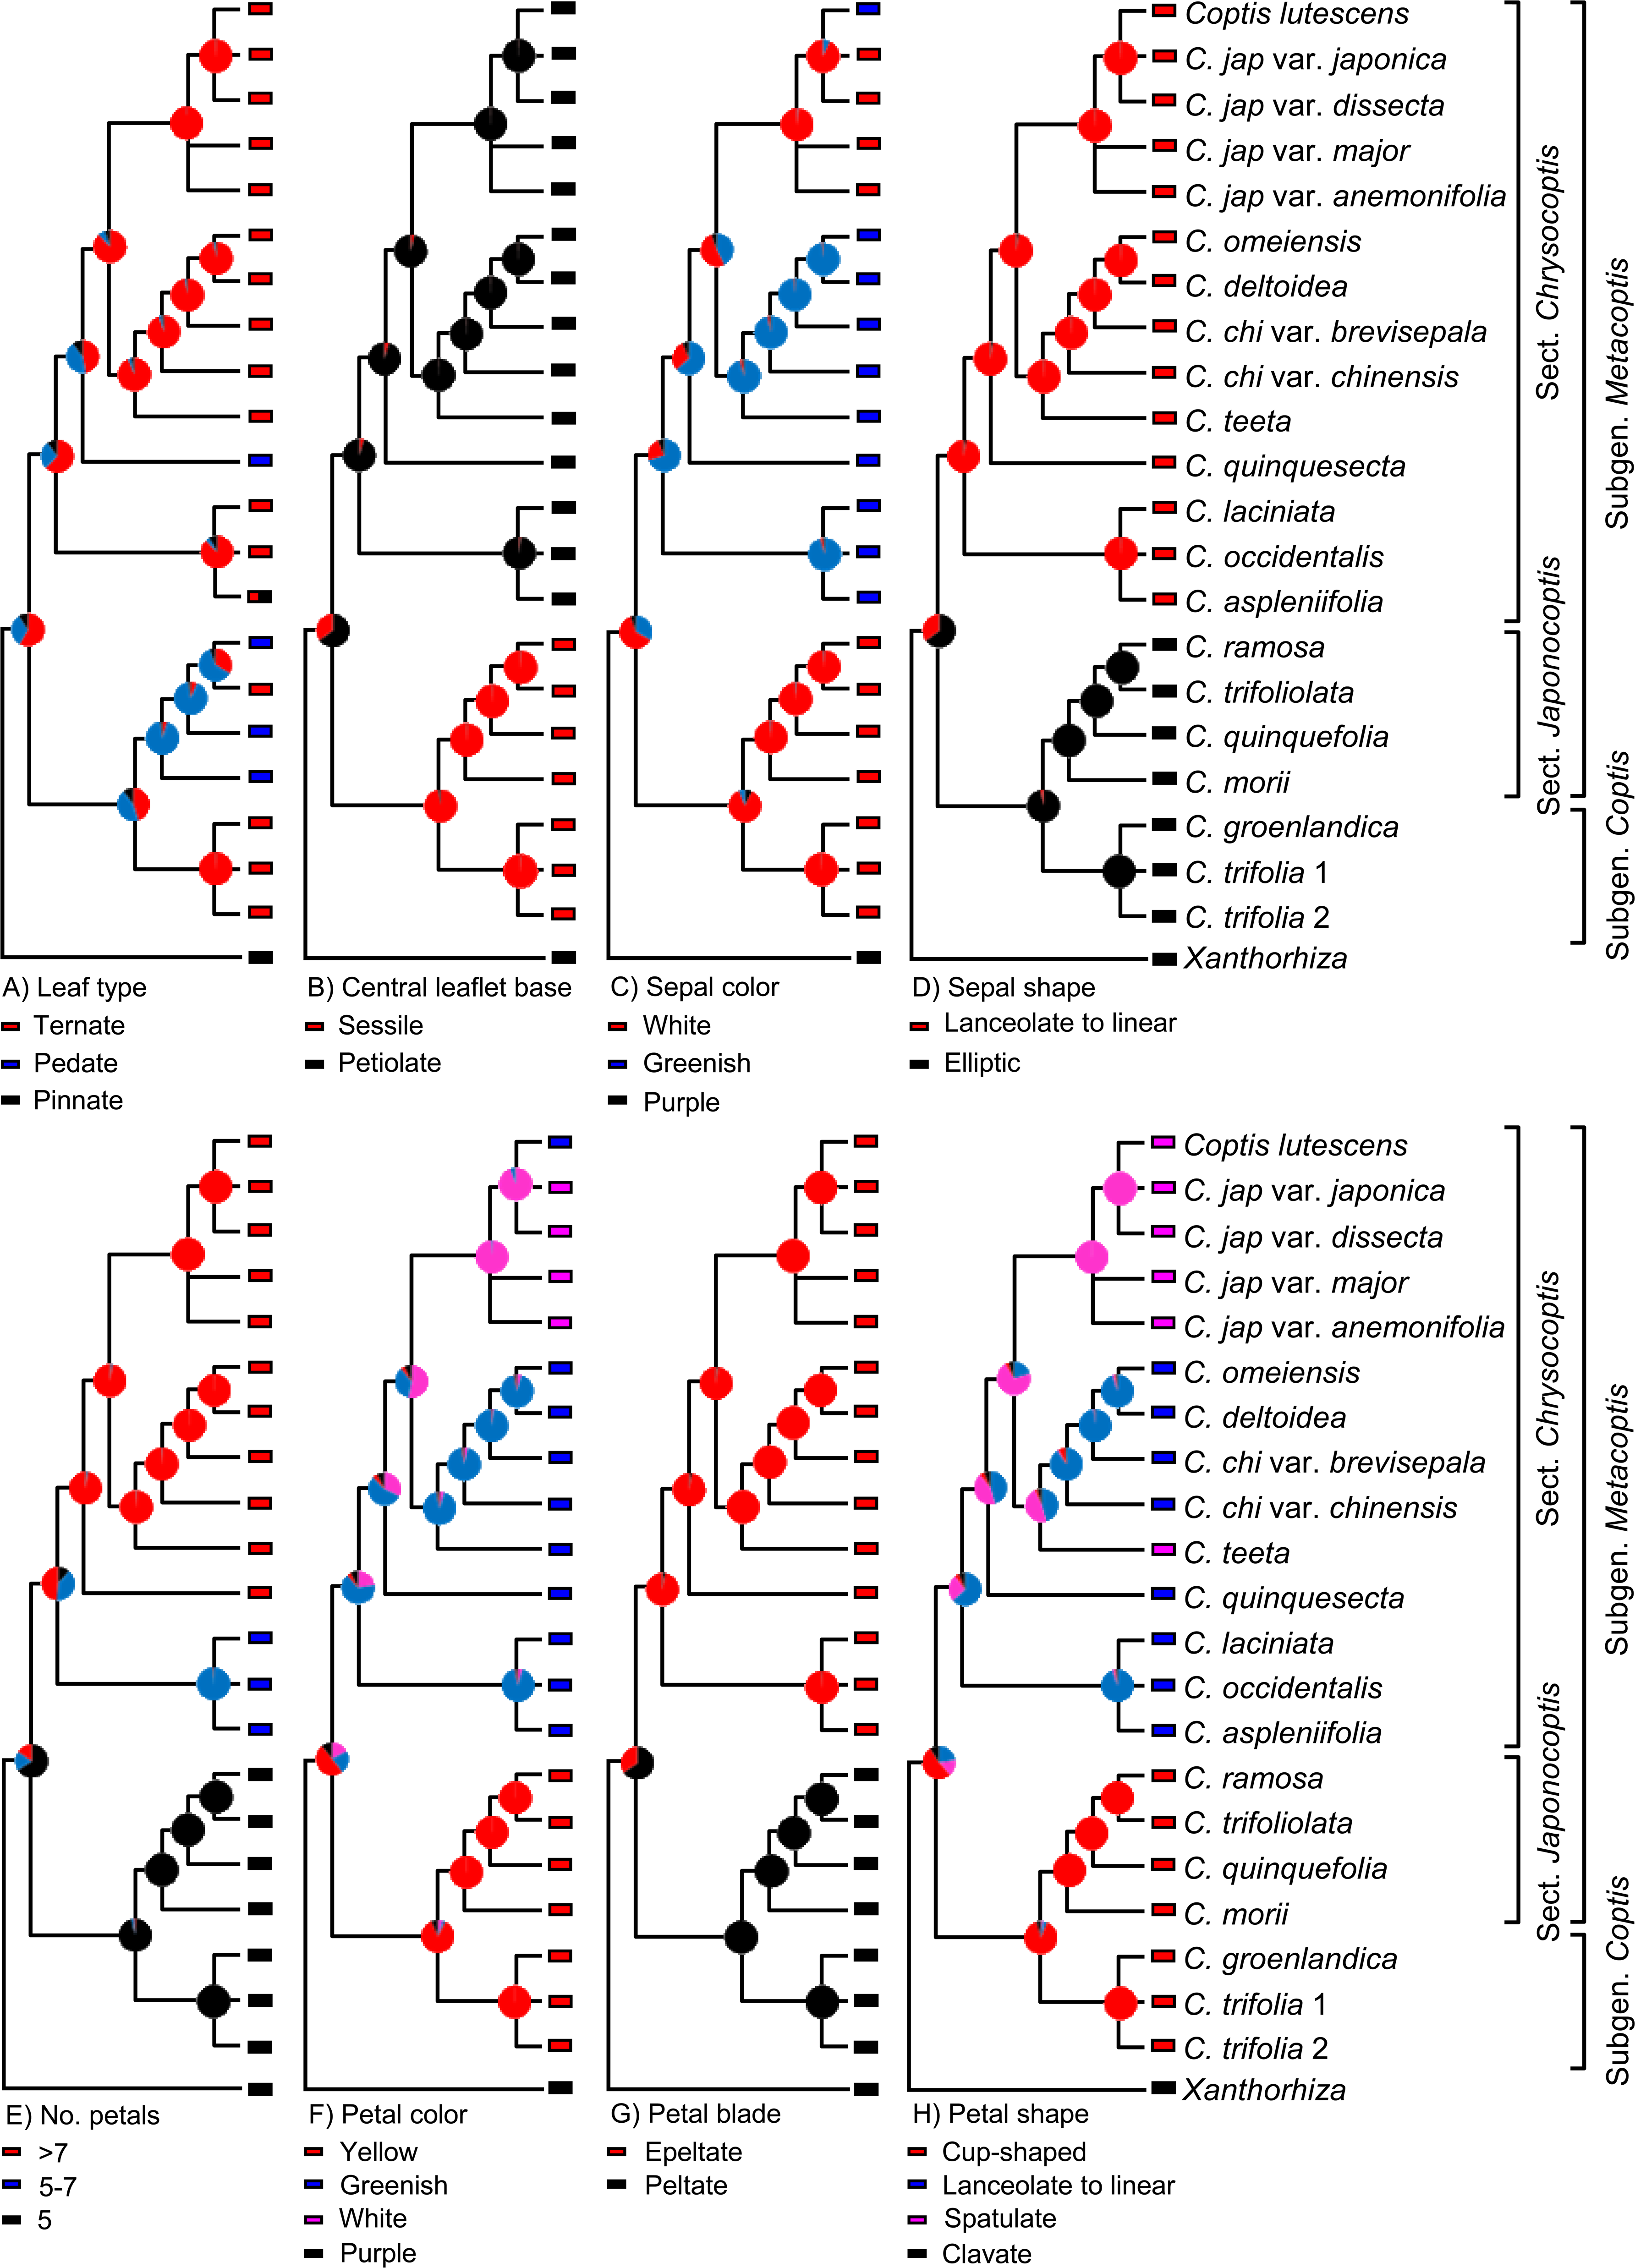
Image is from fig. 6 in Xiang et al. (2016 in PLoS ONE). Original caption: "The evolutionary reconstruction of selected morphological characters in Coptis. Color-coded pie diagrams at each node show the relative probabilities of alternative ancestral states." Used in accordance with Creative Commons Attribution 4.0 International (CC BY 4.0) license.
Review
Question
Which two of the following types of characters do not provide useful grouping information for parsimony-based phylogenetic analyses: autapomorphies, synapomorphies, or plesiomorphies.
Answer
Autapomorphies and plesiomorphies.
Question
What is the technical term for a shared, derived character?
Answer
Synapomorphy.
Question
What is the technical term for a character that is present in only one of the terminal taxa?
Answer
Autapomorphy.
Question
Red, tube-shaped flowers have independently evolved in multiple groups of flowering plants (angiosperms). What is the technical term for such a feature in a phylogenetic context?
Answer
Homoplasious character (or, homoplasy).
Question
All snails have a feeding structure called a radula, so the presence of this feature is not useful for determining relationships among different groups of snails. In this context, what kind of character is a radula?
Answer
Plesiomorphy.
Question
What is the purpose of including an outgroup taxon in an phylogenetic analysis?
Answer
Outgroup taxa, by definition, posses plesiomorphic characters. Their inclusion serves to polarize the characters of the ingroup as either plesiomorphic (same condition as the outgroup) or derived (different condition from the outgroup).
References
Davis, M. P., J. S. Sparks, and W. L. Smith. 2016. Repeated and widespread evolution of bioluminescence in marine fishes. PLoS ONE 11(6): e0155154. https://doi.org/10.1371/journal.pone.0155154.
Xiang K.-L., S.-D. Wu, S.-X. Yu, Y. Liu, F. Jabbour, A. S. Erst, L. Zhao, W. Wang, and Z.-D. Chen. 2016. The first comprehensive phylogeny of Coptis (Ranunculaceae) and its implications for character evolution and classification. PLoS ONE 11(4): e0153127. https://doi.org/10.1371/journal.pone.0153127.
Content usage
Usage of text and images created for DEAL: Text on this page was written by Elizabeth J. Hermsen and Jonathan R. Hendricks. Original written content created by Elizabeth J. Hermsen and Jonathan R. Hendricks for the Digital Encyclopedia of Ancient Life that appears on this page is licensed under a Creative Commons Attribution-NonCommercial-ShareAlike 4.0 International License. Original images created by Jonathan R. Hendricks are also licensed under Creative Commons Attribution-NonCommercial-ShareAlike 4.0 International License.
Content sourced from other websites: Attribution, source webpage, and licensing information or terms of use are indicated for images sourced from other websites in the figure caption below the relevant image. See original sources for further details. Attribution and source webpage are indicated for embedded videos. See original sources for terms of use. Reproduction of an image or video on this page does not imply endorsement by the author, creator, source website, publisher, and/or copyright holder.