

Chapter contents:
Systematics
— 1. Taxonomy
— 2. Phylogenetics
—— 2.1 Reading trees ←
—— 2.2 Building trees
—— 2.3 Character mapping
—— 2.4 Phylogenetic trees and classification
Parts of a tree
A phylogenetic tree is an illustration depicting the hypothesized degrees of evolutionary relationship amongst a selected set of taxa (singular = taxon). The taxa are typically species, but can also be higher-level Linnaean groupings like genera or families. Alternatively, some phylogenetic trees depict relationships among individuals within a species (e.g., from geographically isolated populations). Regardless of their rank, the taxa depicted in a phylogenetic tree are often called terminal taxa, because they occur at the tips of the tree. They are sometimes referred to as "terminals" or "leaves."
Terminal taxa are connected by branches. The branches are the line segments that make up the tree. Branches come together at branching points called nodes. Each nodes represents a common ancestor shared by two or more terminal taxa.
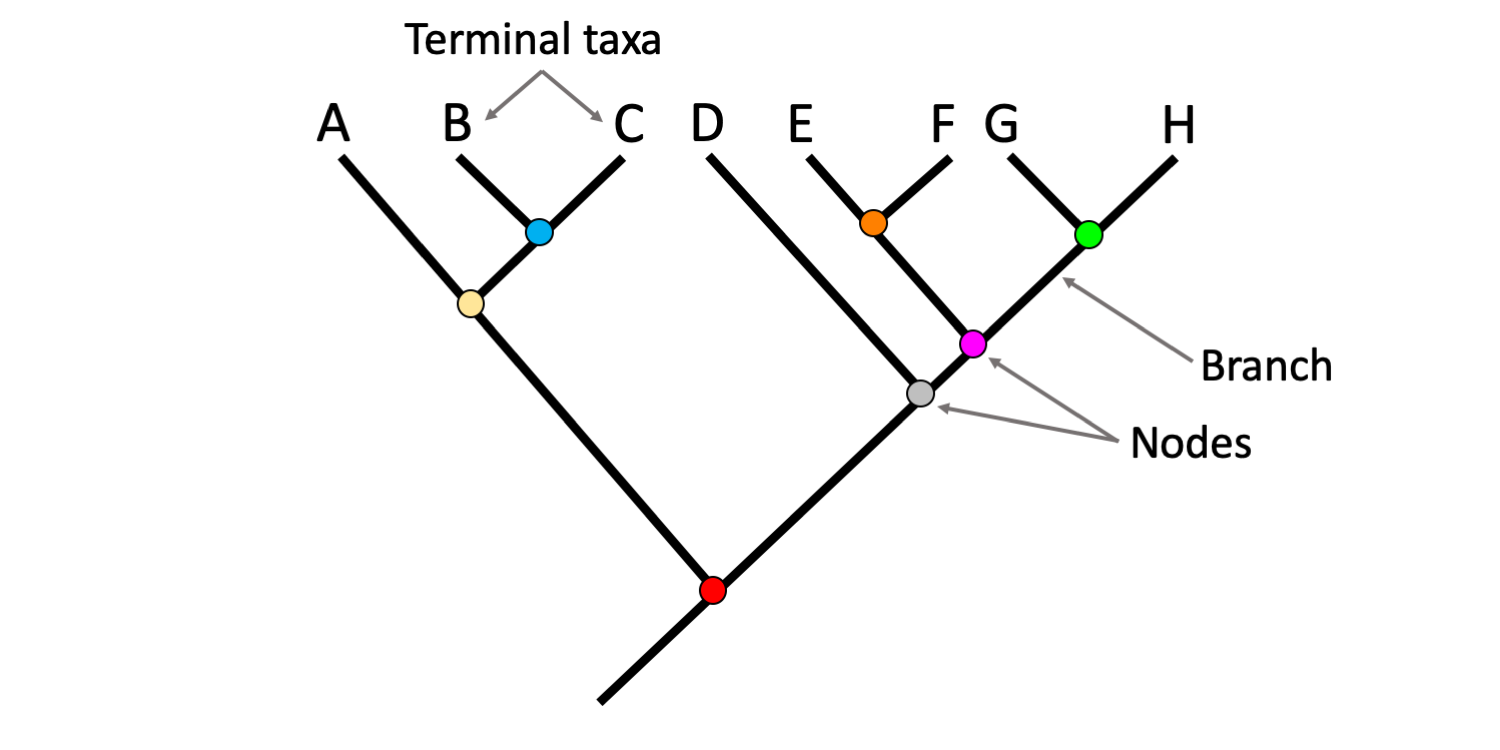
Parts of a phylogenetic tree, including terminal taxa, branches, and nodes. Image by Jonathan R. Hendricks (Creative Commons Attribution-Sharealike 4.0 International license).
The Relatedness of Taxa
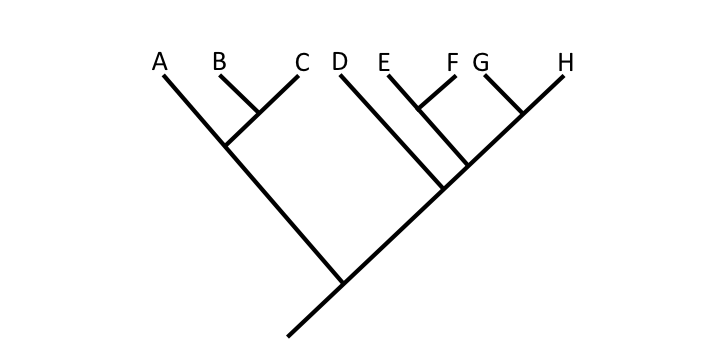
Remember that phylogenetic trees depict degrees of relationship among taxa. On a phylogenetic tree, more closely related terminal taxa are connected by shallower nodes (i.e., nodes nearer to the tips of the tree) and more distantly related terminal taxa are connected by deeper nodes (i.e., nodes nearer to the base of the tree).
Examine the figure above. In that figure, Taxon B and Taxon C are more closely related to one another that either is to Taxon A. We know this because Taxon B and Taxon C share a shallower node (the blue node) than then node that either shares with Taxon A (the yellow node). Another way of putting this observation is that Taxon B and Taxon C share a node (the blue node) that neither shares with Taxon A. Taking a broader view, we also know that Taxa A, B, and C are more closely related to each other than they are to Taxa D, E, F, G, and H. This is because Taxa A, B, and C share the yellow node in common, which does not link to Taxa D, E, F, G, or H. Taxa A, B, and C are linked to Taxa D, E, F, G, and H by a deeper node (the red node).
Branches may be rotated about nodes without any change in the hypothesized relationships depicted on a tree diagram. Convince yourself that the three trees below depict the exact same set of relationships among Taxa A-H. In each case, the only change that has been made is that branches and the terminal taxa connected to them have been rotated around nodes. Remember, the degree of relationship amongst various combinations of terminal taxa is indicated by the relative depth of the nodes that connect them.
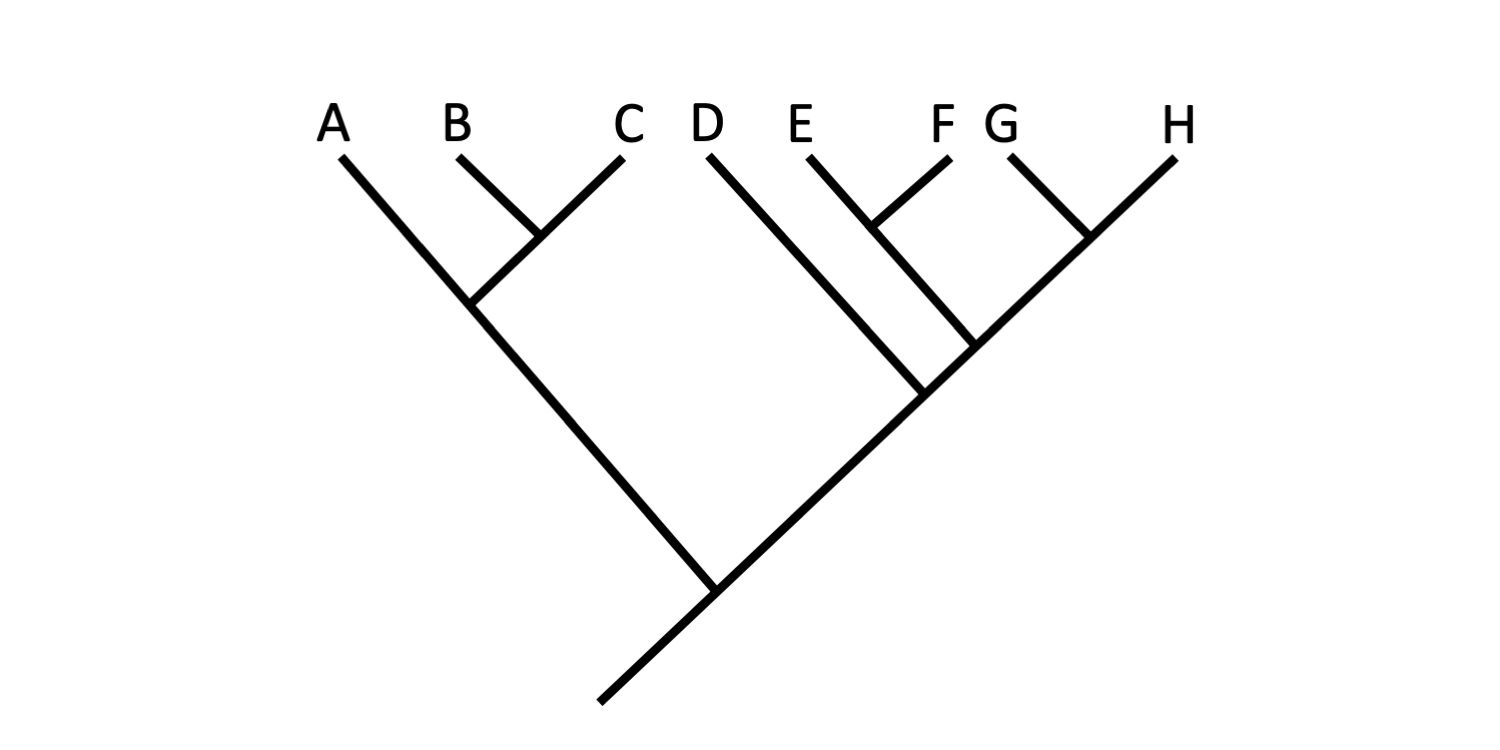
Tree A. Image by Jonathan R. Hendricks (Creative Commons Attribution-Sharealike 4.0 International License).
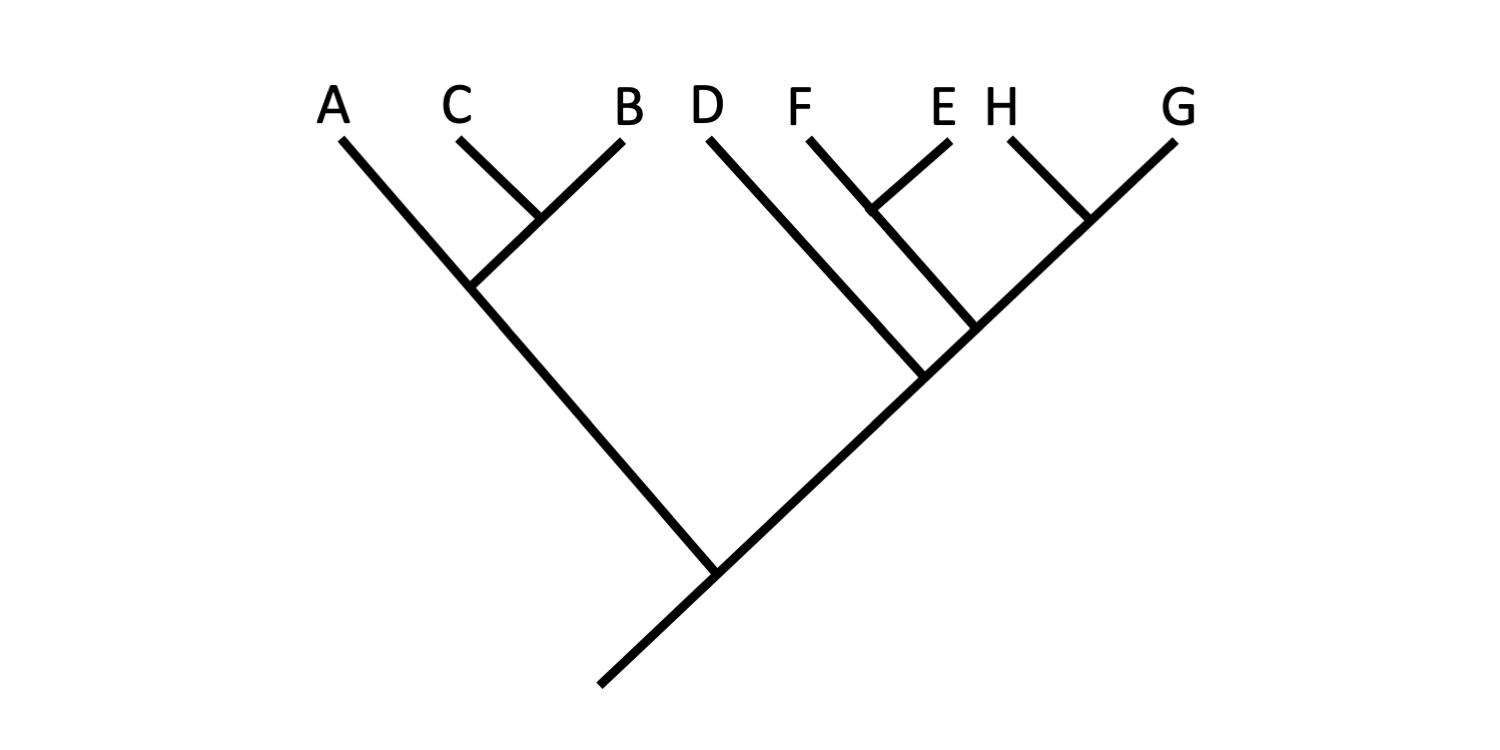
Tree B. Image by Jonathan R. Hendricks (Creative Commons Attribution-Sharealike 4.0 International License).
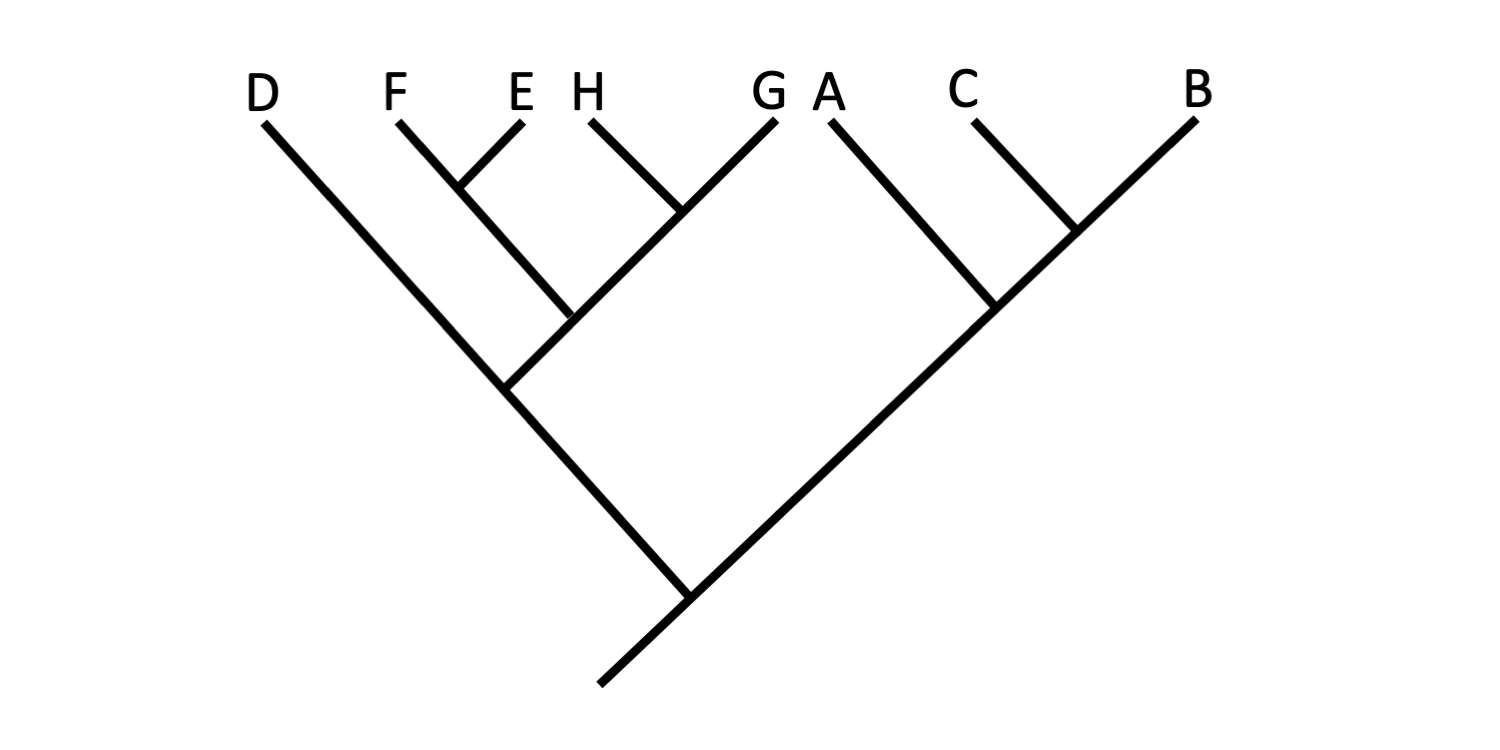
Tree C. Image by Jonathan R. Hendricks (Creative Commons Attribution-Sharealike 4.0 International License).
The graphic style of phylogenetic trees varies. For example, the tree shown below depicts the exact same pattern of relationships among Taxa A–H as the three trees shown above.
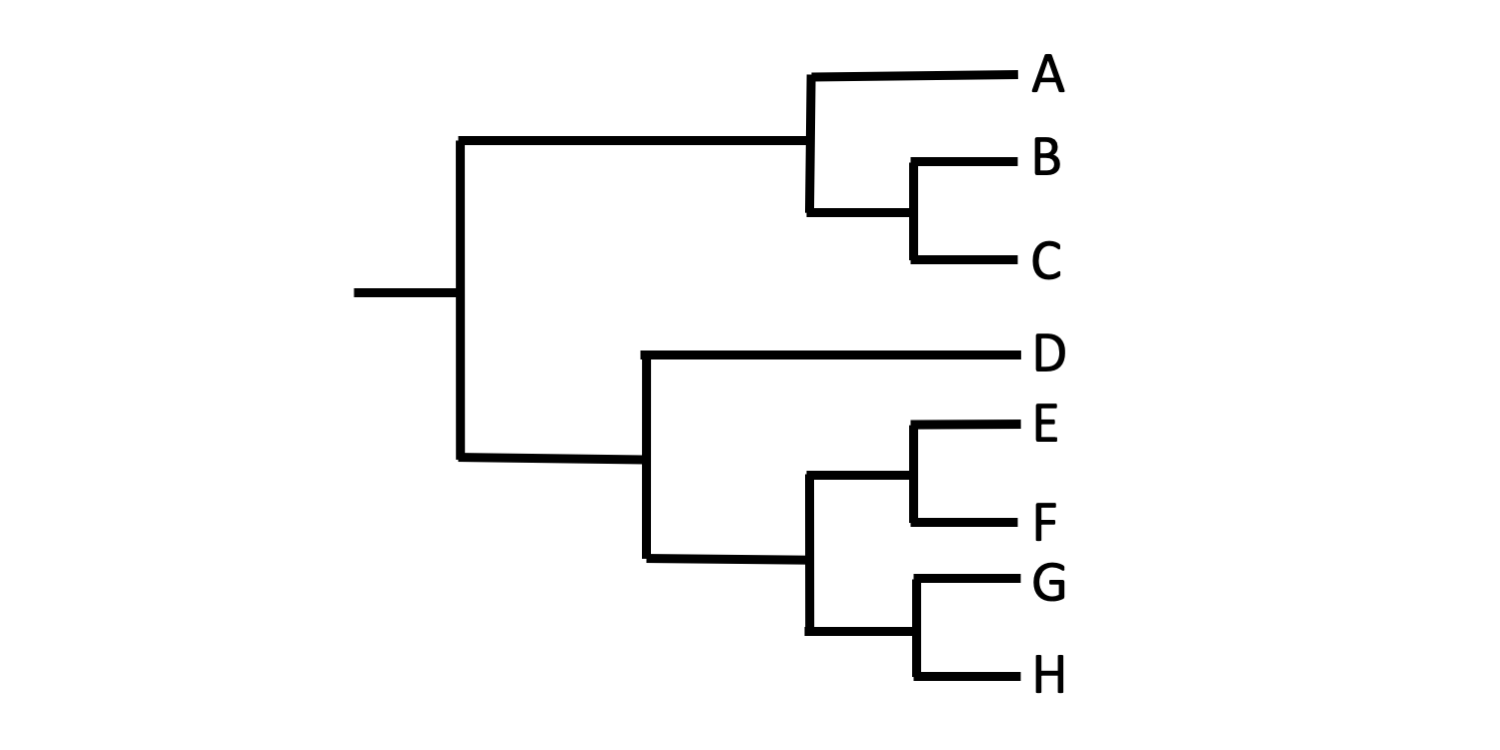
A bracket-style phylogenetic tree. Image by Jonathan R. Hendricks (Creative Commons Attribution-Sharealike 4.0 International License).
Increasingly, it is common to see circle-shaped phylogenetic trees such as the one shown below. Circular trees are often used to illustrate relationships among members of major groups of extant organisms, and these trees may have many terminal taxa. Circular trees can be read in the same way as the trees shown above, because the relative depth of the nodes indicates the degree of relatedness among terminals.
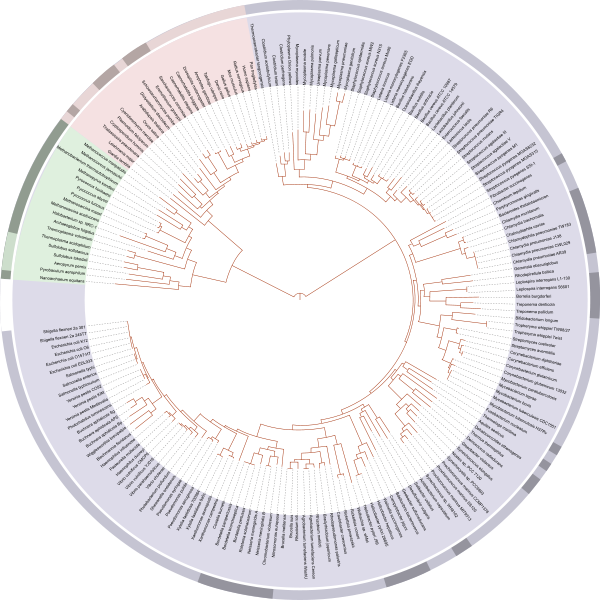
A circle-shaped phylogenetic tree that depicts relationships among the major groups of living organisms (blue = bacteria; green = Archaea; pink = eukaryotes). This tree was created by Ivica Letunic and was retraced by Mariana Ruiz Villarreal (public domain).
Clades and Sister Groups
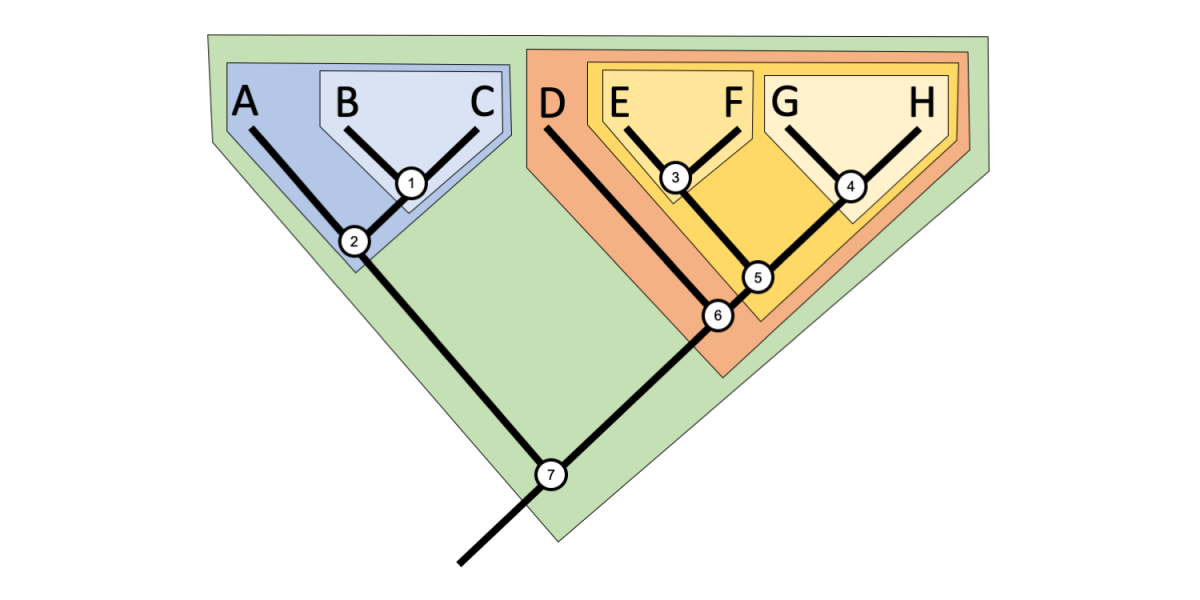
A clade (from the Greek klados = branch) is a group that includes an ancestor (node) and all of its descendants (all shallower nodes and terminal taxa that descend from that node) on a phylogenetic tree. If you pick a node on a phylogenetic tree, you can easily draw a circle around the clade that it defines, as in the tree below. While many clades have no formal names, some important clades are named in formal classification schemes (for more on clades and classification, see this later section).

A phylogenetic tree that illustrates the concept of clades. Note that clades are not mutually exclusive, but are nested within one another. Image by Jonathan R. Hendricks (Creative Commons Attribution-Sharealike 4.0 International license).
Clades are not mutually exclusive, but rather form nested sets on a tree. Thus, any given taxon can belong to many clades. For example, in the tree above, Taxon B belongs to three clades, a clade defined by Node 1, a more inclusive clade defined by Node 2, and an even more inclusive clade defined by Node 7. Taxon E belongs to four clades defined by Nodes 3, 5, 6, and 7, respectively. Try to figure out how many clades Taxon A and Taxon H belong to, and determine which nodes define each clade.
Sister taxa or sister groups are pairs of terminal taxa and/or clades that branch from a common node and are often considered closely related. Pairs of sister terminal taxa in the figure above include: B and C, E and F, and G and H. The clade defined by Node 3 (Node 3 + Taxon E + Taxon F) is sister to the clade defined by Node 4 (Node 4 + Taxon G + Taxon H). Terminal taxon A is sister to the clade defined by Node 1 (Node 1 + Taxon B + Taxon C). Try to find more sister pairs on the tree above.
The Meaning of Branch Lengths
Two things are implicitly occurring along the branches of a phylogenetic tree. The first is the passage of time. Deeper nodes are older than the shallower nodes to which the are connected. Thus, deeper nodes indicate both more distant relationships among the terminal taxa that they connect, as well a greater age for the most recent common ancestor of those taxa. The second thing is evolutionary modification, or the accumulation of hereditary genetic and/or structural changes along branches. While these changes are often not shown (mapped) directly on the branches, it is these inferred changes that underpin the construction and interpretation of a phylogenetic tree. When systematists talk about "branch lengths," they are typically referring to the number of these changes.
So, does the length of the branches as depicted on a phylogenetic tree (in other words, the length of the branches on an actual diagram showing a hypothesis of evolutionary relationships) mean anything? The answer is: it depends.
Time and number of evolutionary changes may have no direct relationship to the relative lengths of branches as depicted on a tree. Many such trees are cladograms, or branching diagrams made using clastic methods, which have their roots in the work of Willi Hennig. (Note: The term "cladogram" is sometimes applied to any type of phylogenetic tree.) Often, diagrams that are drawn for general informational purposes to depict a consensus hypothesis of relationships amongst a group of taxa (for example, in a textbook) also do not have branches scaled to time or to number of evolutionary changes. In this type of diagram, the taxa will either be aligned at the branch tips or all branches will be about the same length (meaning that the taxa are not aligned).
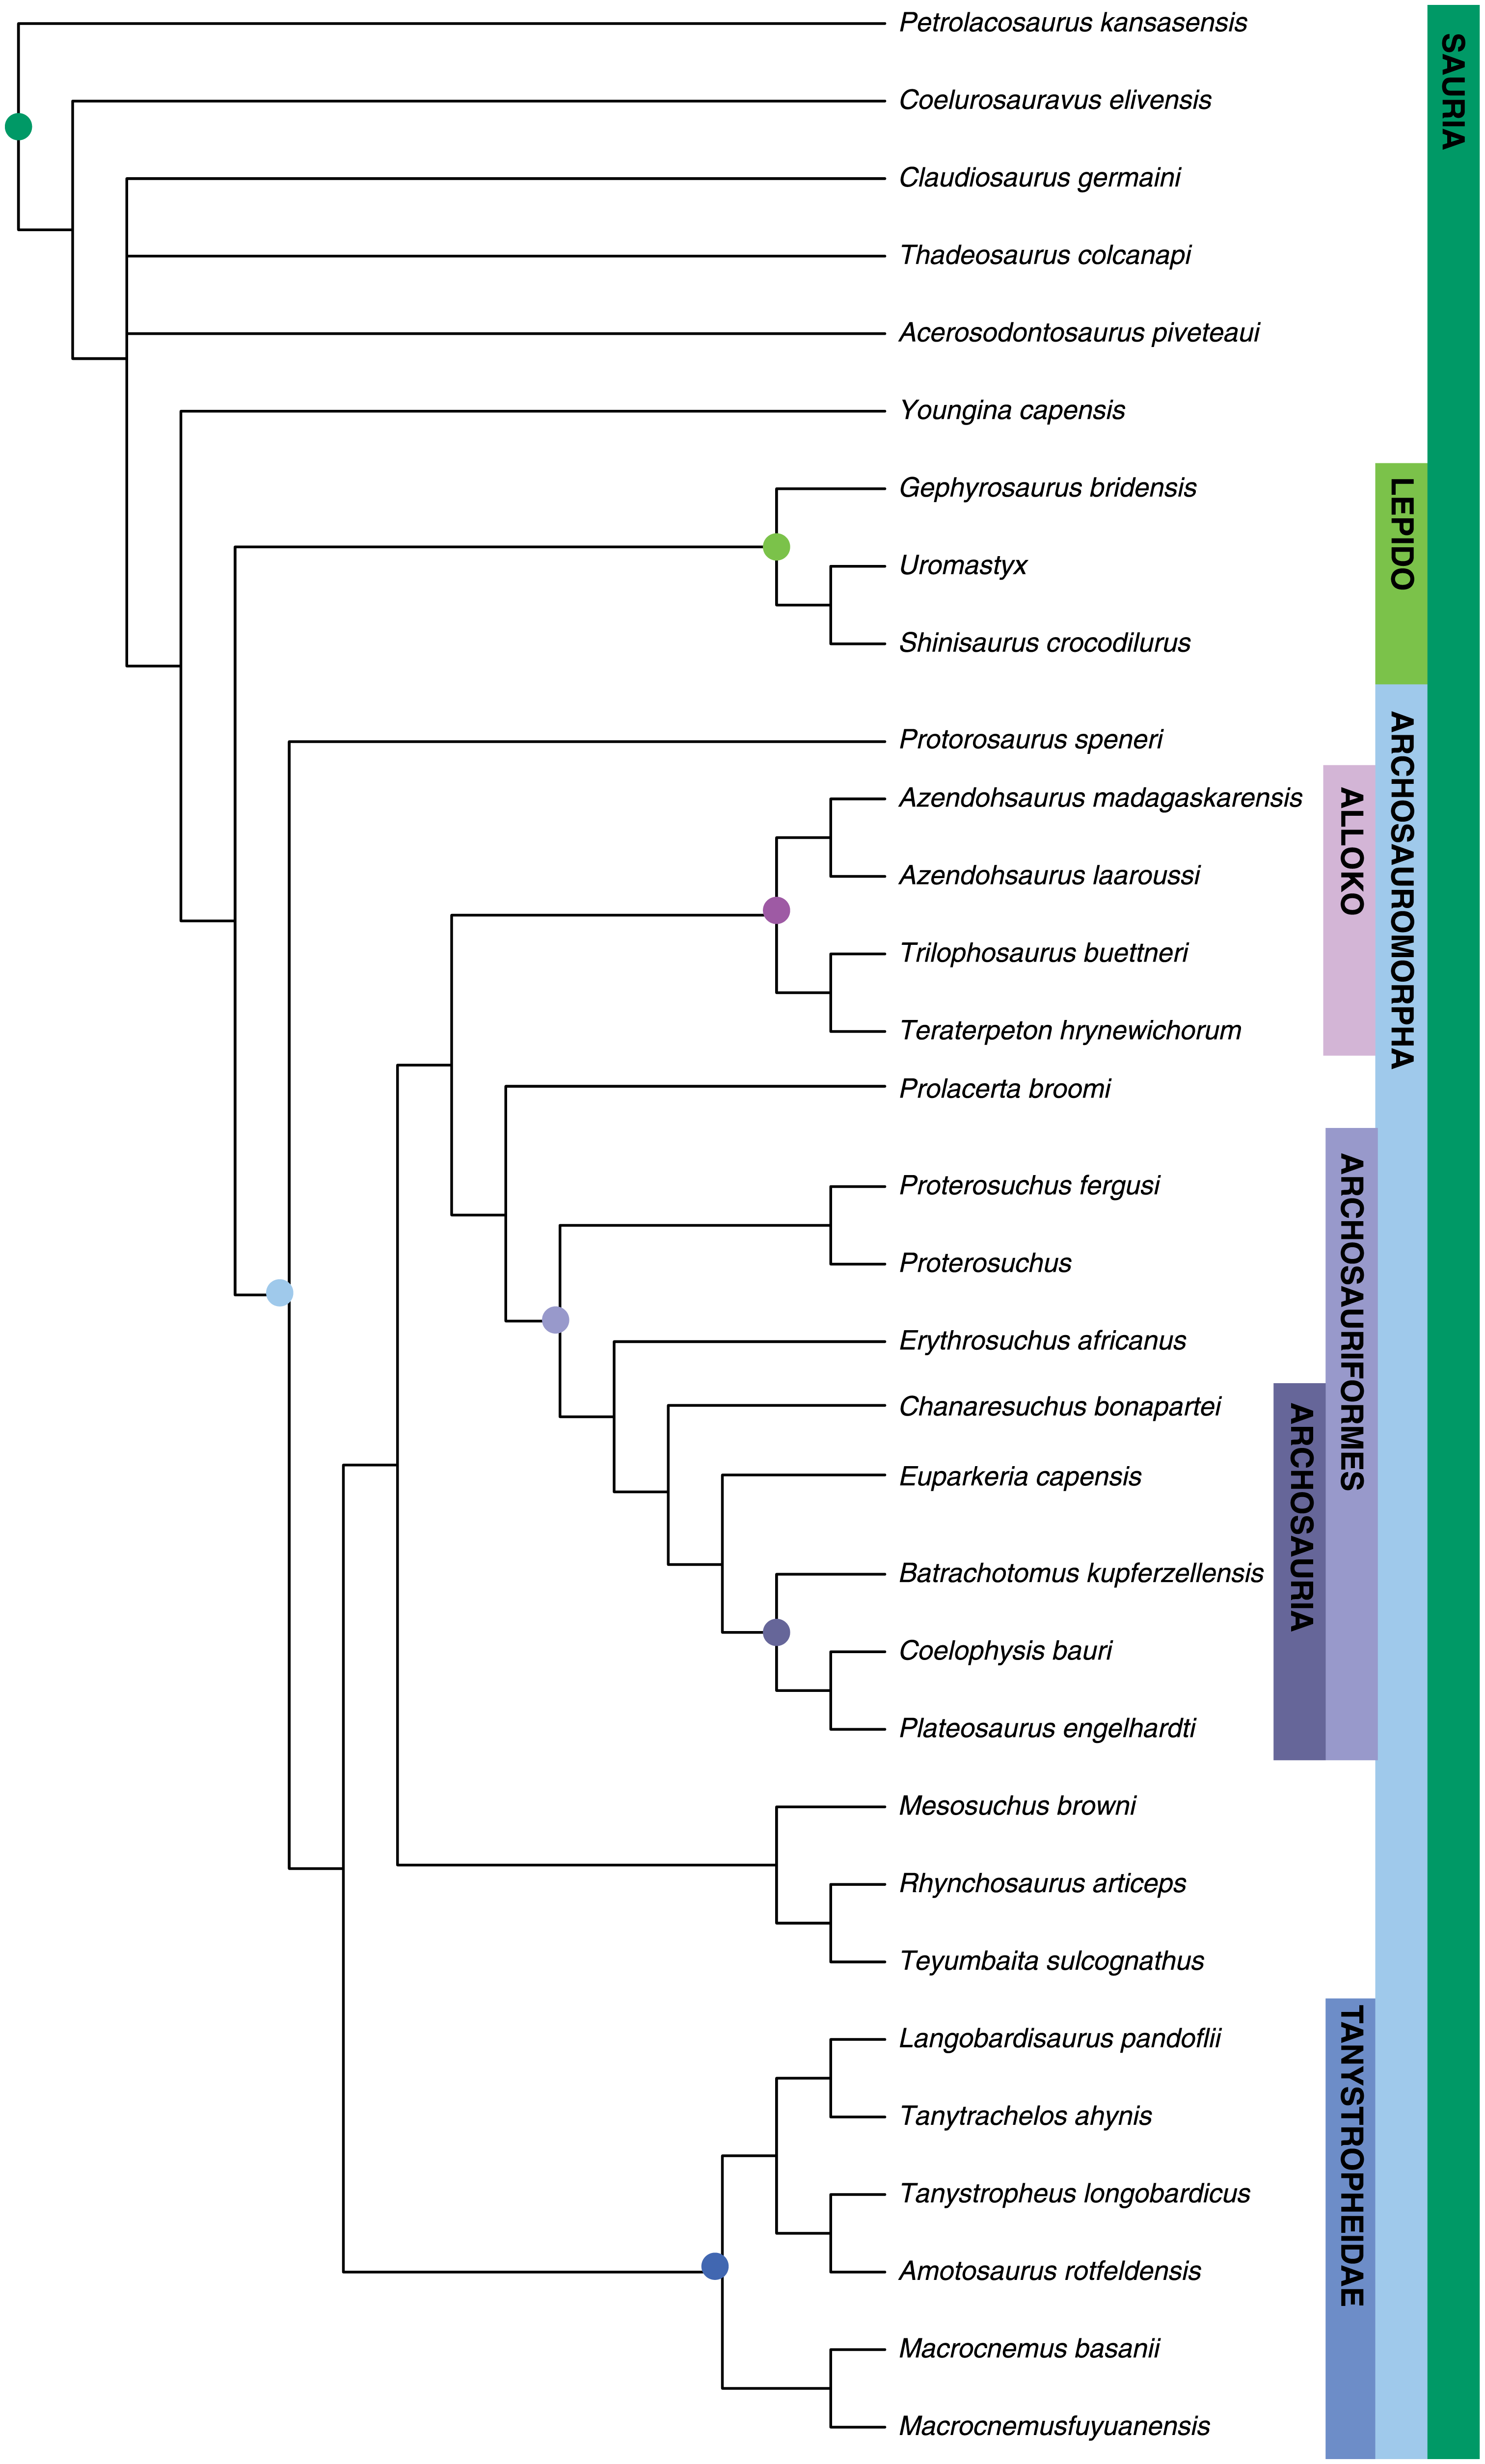
A phylogenetic tree in which the branches are not scaled to time or evolutionary change. This diagram is a cladogram. From: Turner et al. (2017) PLoS ONE 12(2): e0169885. Used in accordance with Creative Commons Attribution 4.0 International (CC BY 4.0) License.
In other cases, branches on a tree are scaled so that they reflect the amount of evolutionary change (in other words, the number of modifications in characteristics) that has occurred. In this type of diagram, branch lengths will differ and taxa will not be aligned at the branch tips. Sometimes this type of tree is called a phylogram.
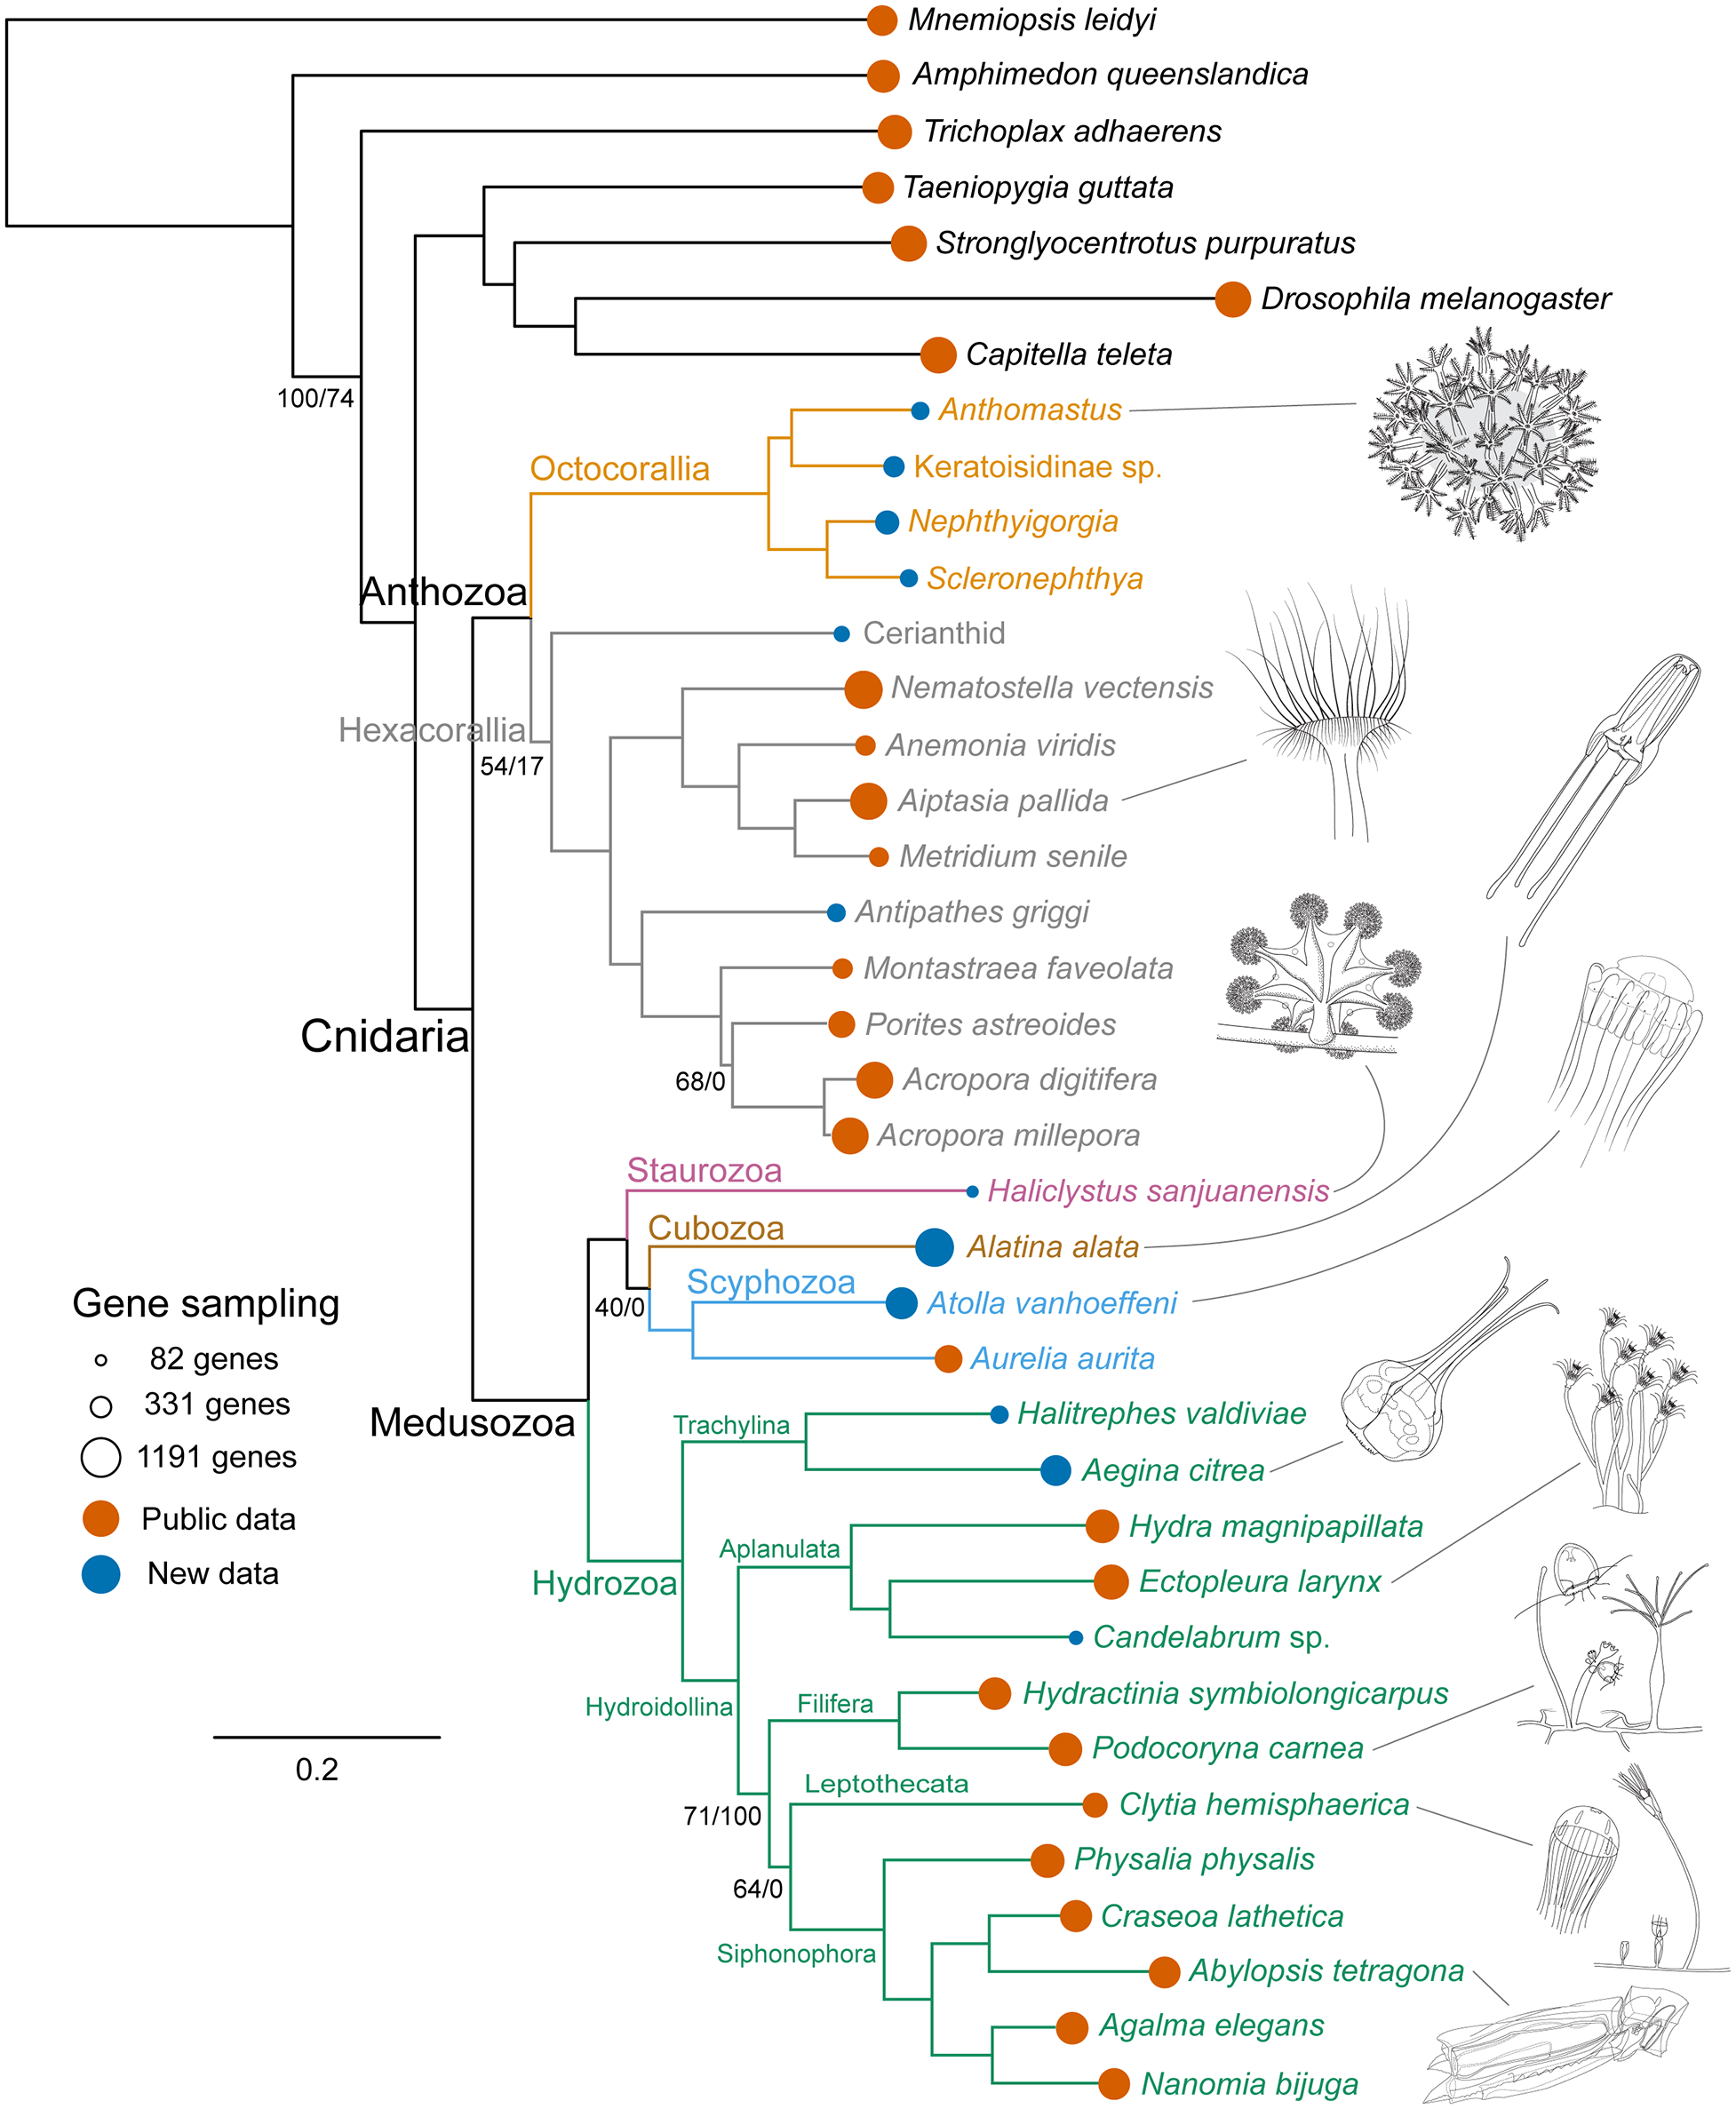
Example of a phylogenetic tree with branches scaled to depict number of evolutionary changes (a phylogram). Notice the the branch lengths on the diagram differ and the taxa are not aligned. From: Zapata et al. (2015) PLoS ONE 10(10): e0139068. Used in accordance with Creative Commons 0 1.0 Universal, Public Domain Dedication (CC0 1.0).
Trees may also have branch lengths that are scaled to time, making the relationship between relative node depth and time explicit. Typically, a time scale (relative and/or numerical) will be included beside the tree to indicate the timing of branching events. If a tree is explicitly scaled to time, it can be called a chronogram; such trees are also sometimes called "time trees" (also time-trees or timetrees). If all taxa in a chronogram are extant (living), they will be aligned at the present.
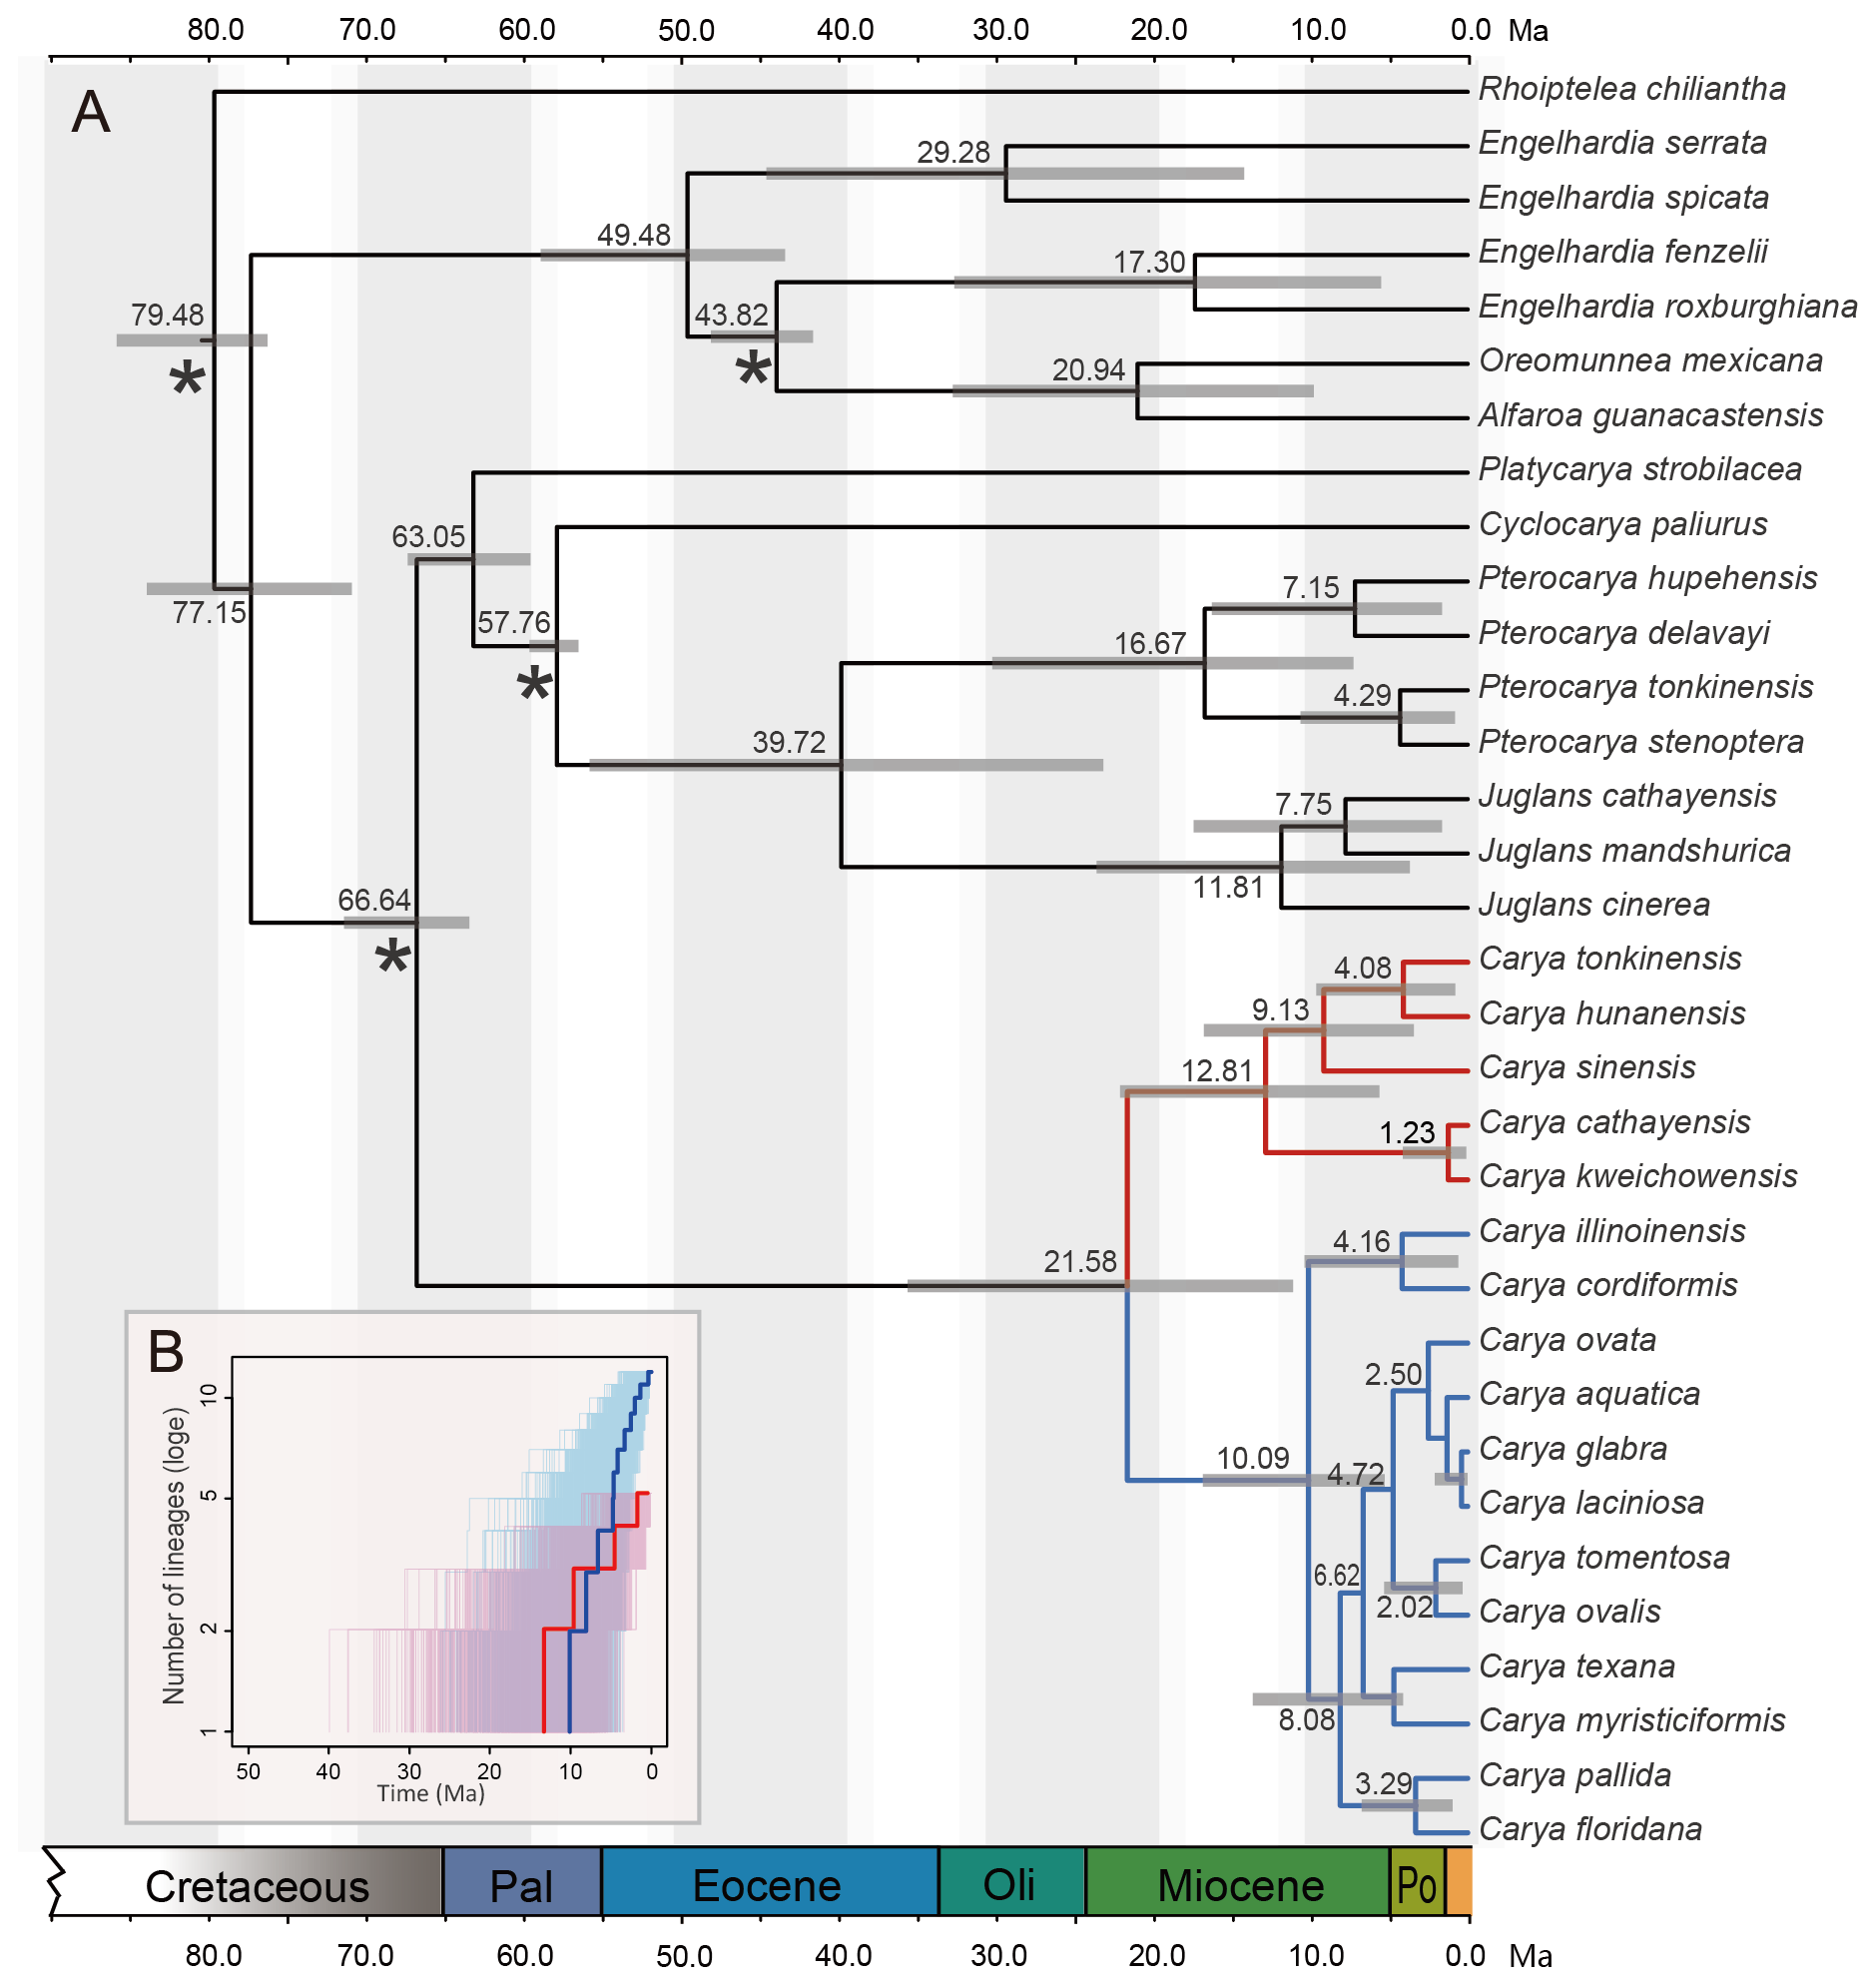
Example of a phylogenetic tree with branches scaled to depict time (a chronogram). The gray bars at the nodes are error bars. From: Zhang et al. (2013) PLoS ONE 8(7): e70449. Used in Accordance with Creative Commons Attribution (CC BY) License.
Sometimes, extinct taxa may be included as terminals on a phylogenetic tree. If such a tree has branches scaled to time, extinct taxa will not be aligned at the present time. Rather, the branch tips for extinct taxa will end at the levels in time at which they went extinct, as shown below.
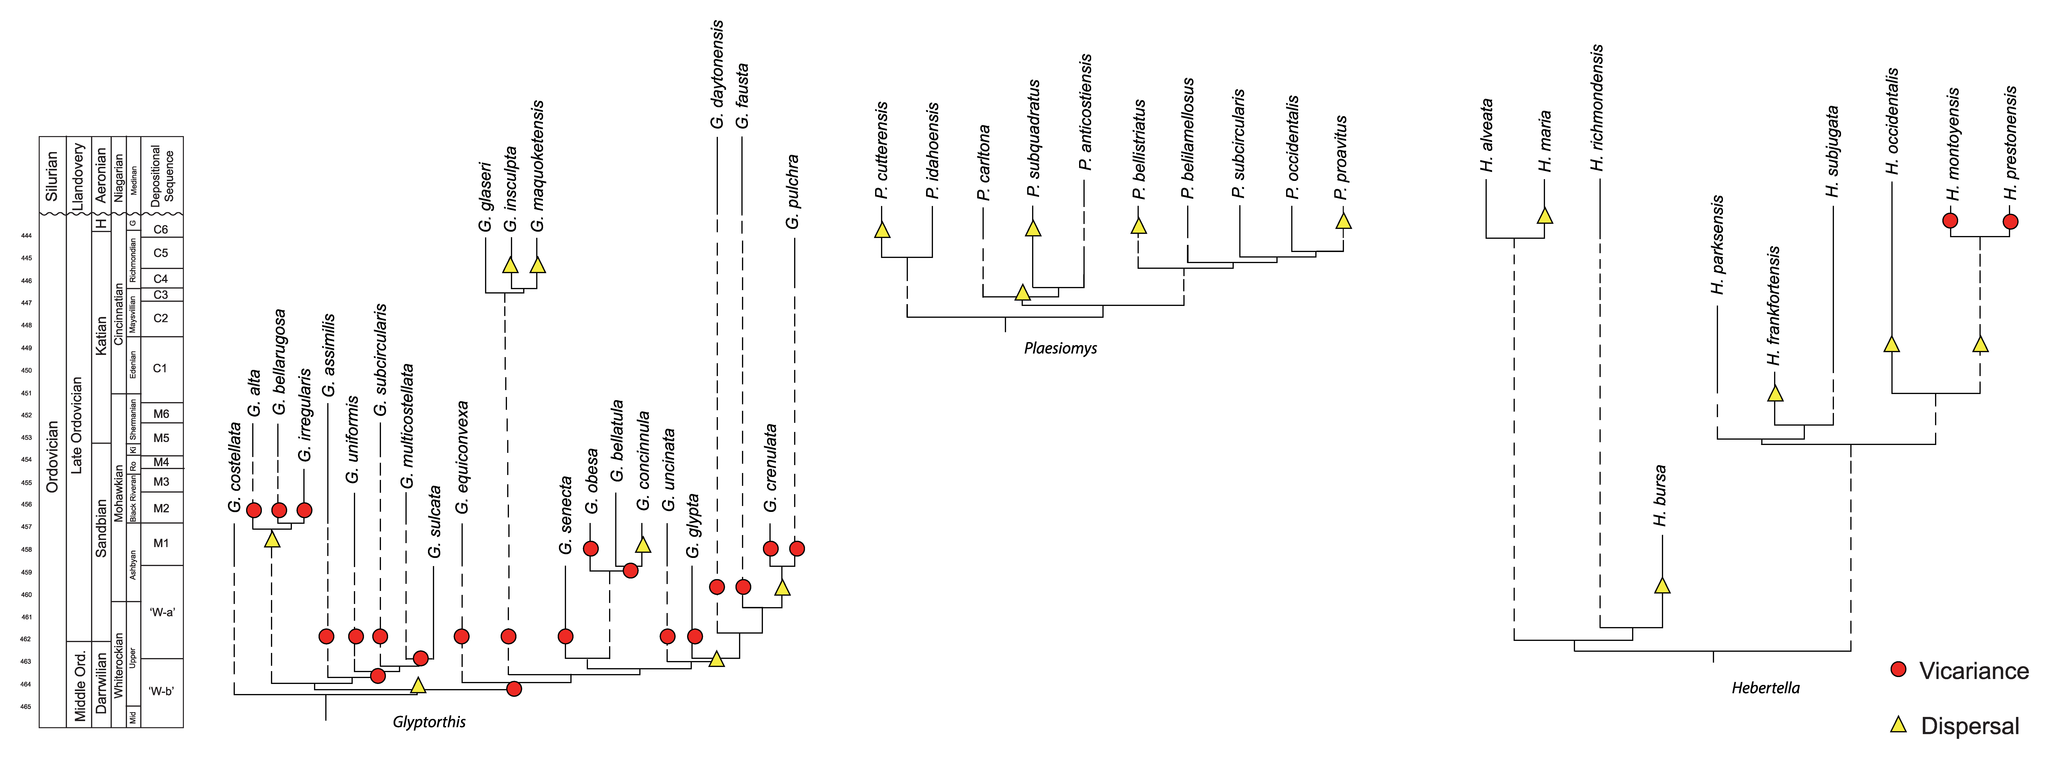
Examples of cladograms scaled to time and including extinct taxa as terminals. From: Wright and Stigall (2013) PLoS ONE 8(7): e68353. Used in Accordance with Creative Commons Attribution (CC BY) License.
Review
Question
In this phylogenetic tree, what is Taxon B's sister taxon?
Answer
Taxon C.
Question
In this phylogenetic tree, what is Taxon D's sister taxon?
Answer
The clade that includes Taxa E, F, G, and H.

Question
In this phylogenetic tree, the identified node represents the shared common ancestor of which taxa?
Answer
Taxa D, E, F, G, and H.
References
Turner, A. H., A. C. Pritchard, and N. J. Matzke. 2017. Epirical and bayesian approaches to fossil-only divergence times: a study across three reptiles clades. PLoS ONE 12(2): e0169885. https://doi.org/10.1371/journal.pone.0169885.
Wright, D. F. and A. L. Stigall. 2013. Geologic drivers of Late Ordovician faunal change in Laurentia: investigating links between tectonics, speciation, and biotic invasions. PLoS ONE: 8(7): e68353. https://doi.org/10.1371/journal.pone.0068353.
Zapata, F., F. E. Goetz, S. A. Smith, M. Howison, S. Siebert, S. H. Church, S. M. Sanders, C. L. Ames, C. S. McFadden, S. C. France, M. Daly, A. G. Collins, S. H. D. Haddock, C. W. Dunn, and P. Cartwright. 2015. Phylogenomic analyses support traditional relationships within Cnidaria. PLoS ONE 10(10): e0139068. https://doi.org/10.1371/journal.pone.0139068.
Zhang, J.-B., R.-Q. Li, X.-G. Xiang, S. R. Manchester, L. Lin, W. Wang, J. Wen, and Z.-D. Chen. 2013. Intregrated fossil and molecular data reeal the biogeographic diversification of the eastern Asian-eastern North American disjunct hickory genus (Carya Nutt.). PLoS ONE 8(7): e70449. https://doi.org/10.1371/journal.pone.0070449.
Additional resources
The following two papers are recommended for additional information about reading phylogenetic trees:
Baum, D., S. DeWitt Smith, S. S. S. Donovan. 2005. The Tree-Thinking Challenge. Science 310(5750): 979-980. Also note that there is a quiz associated with this article, which may be accessed here.
Content usage
Usage of text and images created for DEAL: Text on this page was written by Elizabeth J. Hermsen and Jonathan R. Hendricks. Original written content created by Elizabeth J. Hermsen and Jonathan R. Hendricks for the Digital Encyclopedia of Ancient Life that appears on this page is licensed under a Creative Commons Attribution-NonCommercial-ShareAlike 4.0 International License. Original images created by Jonathan R. Hendricks are also licensed under Creative Commons Attribution-NonCommercial-ShareAlike 4.0 International License.
Content sourced from other websites: Attribution, source webpage, and licensing information or terms of use are indicated for images sourced from other websites in the figure caption below the relevant image. See original sources for further details. Attribution and source webpage are indicated for embedded videos. See original sources for terms of use. Reproduction of an image or video on this page does not imply endorsement by the author, creator, source website, publisher, and/or copyright holder.