

Chapter contents:
Geological time
– 1. Relative age dating
– 2. Absolute age dating
– 3. Geological time scale
– 4. Geological maps ←
Most maps that we use in our day-to-day lives are two-dimensional: they are flat and show features like roads, cities, and natural features such as lakes and rivers.
Hikers and other outdoor enthusiasts may be familiar with topographical maps, which add a third dimension: elevation. The map below shows a topographic map of the area surrounding Taughannock Falls State Park in central New York. The "contour lines" on the map represent elevation. Lines that are close together indicate steep surfaces, while those that are further apart indicate gentle slopes. On this map, the "contour interval" is 20 feet, meaning that the space between adjacent lines represents a 20 foot change in elevation (relative to sea level).
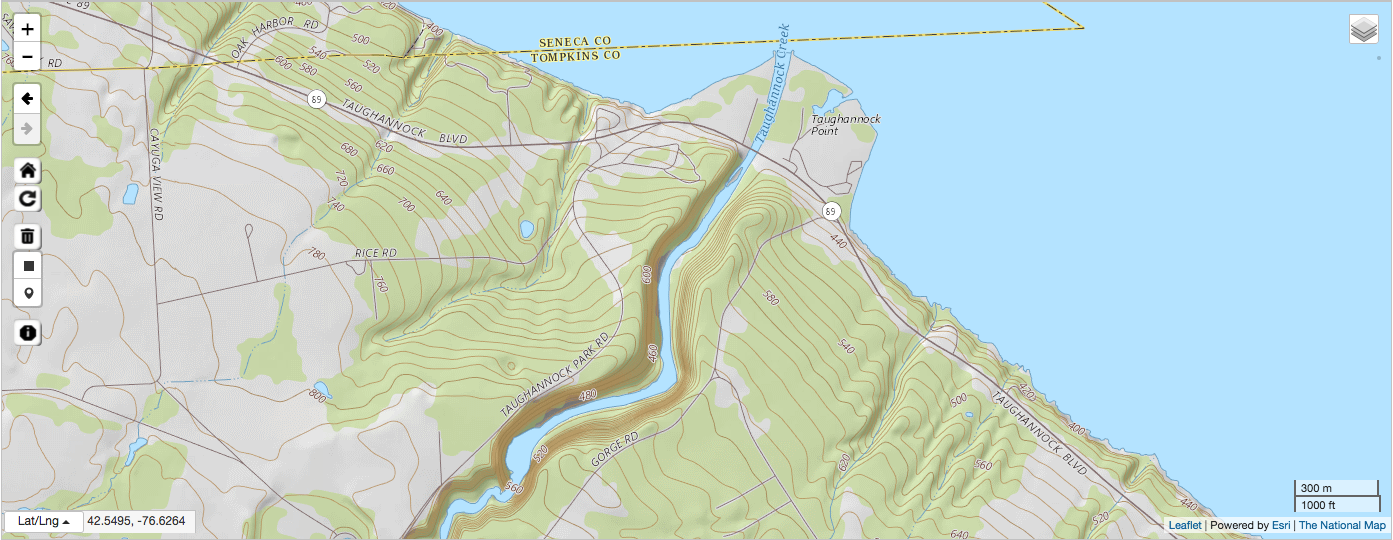
Topographical map of the area near Taughannock Falls State Park in central New York. Image from The National Map, United States Geological Survey (public domain).
Geological maps add a fourth dimension: time. They typically show the types of rocks and other geological features exposed at (or close to) Earth's surface, with rocks of different ages assigned different colors. The geological map below shows the surficial geology near Lawrence, Kansas.
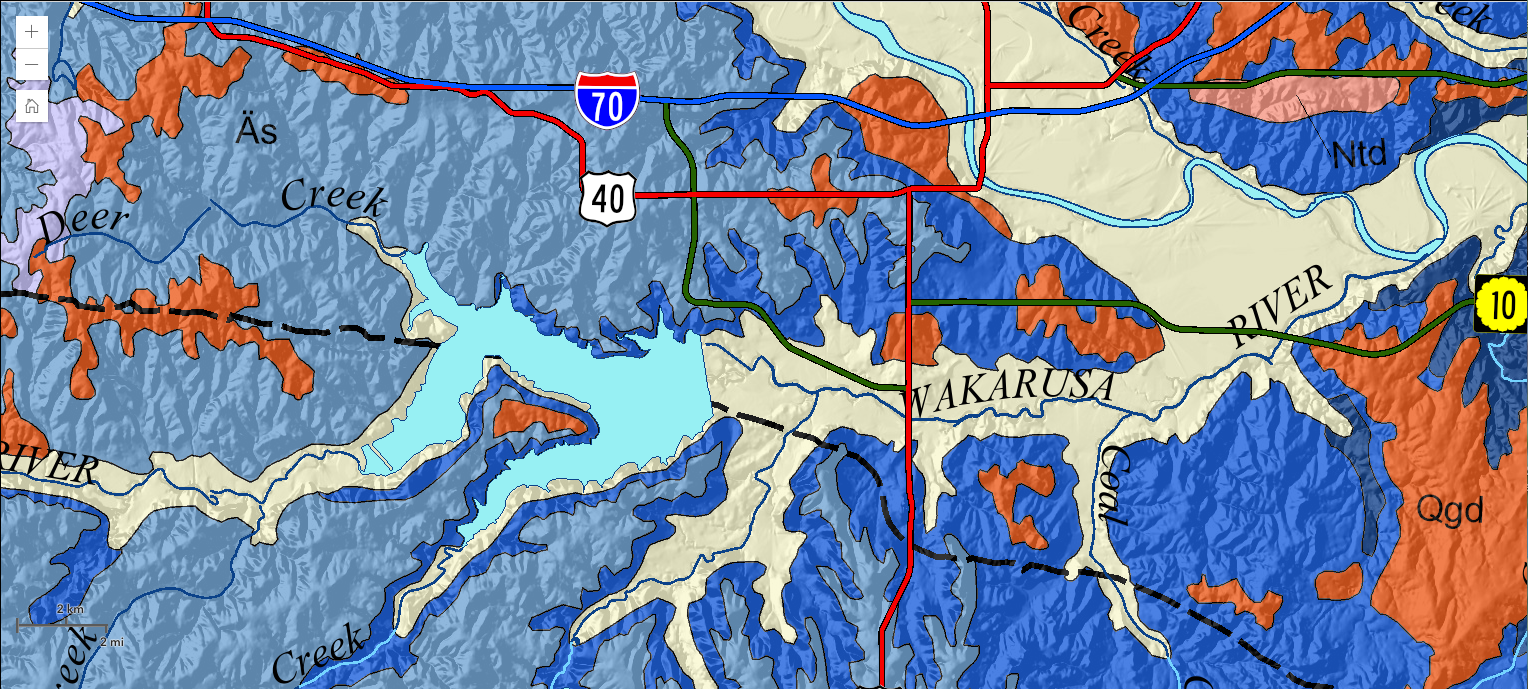
Surficial geological map of the region surrounding Lawrence, Kansas. Map generated using the Interactive Geological Map of Kansas; "The source of this material is the Kansas Geological Survey website at http://www.kgs.ku.edu/. All Rights Reserved."
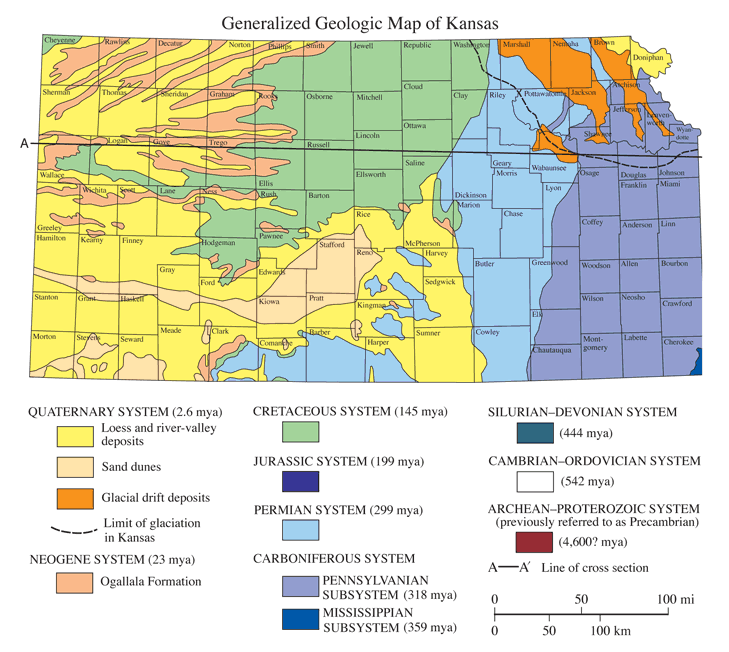
Geological map of Kansas. "The source of this material is the Kansas Geological Survey website at http://www.kgs.ku.edu/. All Rights Reserved."
Again the different colors correspond with the ages of the rocks exposed near the surface (see the key to these colors below the map above). The line marked "A" roughly corresponds with Interstate-70, which connects the eastern and western borders of the state. Imagine driving across Kansas on I-70 (or even better, do it!) from east (Missouri side) to west (Colorado side). The rocks that you would first encounter along the interstate are from the Pennsylvanian period (purple on the map). Drive a little further west, and the rocks become slightly younger in age (Permian; blue on the map). Drive even further west, and the surficial rocks become Cretaceous in age (green on the map). Finally, traveling through far western Kansas, you would encounter primarily Quaternary-aged deposits at the surface.
Thus, driving from eastern to western Kansas on I-70, you generally encounter younger and younger aged surficial rocks. What explains this trend? The answer is topography: the elevation gradually increases as one drives westward across Kansas on I-70, towards Denver, Colorado (the "Mile High City"). Because of the principle of superposition (see Section 2.1) and the fact that the bedrock geology of Kansas is fairly simple, driving upwards in elevation results in encounters with surficial rocks that become younger and younger. Besides driving "upwards in time," you would also find evidence of very different kinds of fossils and ancient ecosystems if you were to explore rocks from these different geological periods, reflecting the evolution and extinction of varied life forms over time.
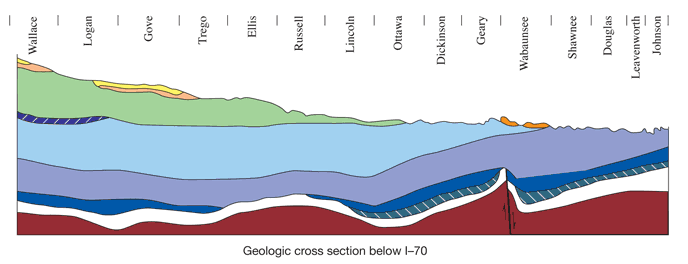
Geological cross section of Kansas along line A-A' on the geological map shown above; the cross section approximates the subsurface geology below Interstate-70. "The source of this material is the Kansas Geological Survey website at http://www.kgs.ku.edu/. All Rights Reserved."
The first geological map
Below is an image of William "Strata" Smith's geological map of England, which was published in 1815. It was the first large-scale geological map of an entire country and its major features remain accurate to the present day. Construction of the map would not have been possible without Smith's careful study of the fossil record and application of the principle of faunal succession (Section 2.3). Sadly, Smith went broke making the map and his great achievement was overlooked by the scientific community for much of his life. Even so, Smith's map sparked a revolution in geology--one that integrated observations of fossils and rocks in the field with fundamental principles of geology, resulting in a guide to understanding the distribution of mineral resources, as well as the broader geological history of England. Indeed, geological mapping remains a key activity for understanding our world and its history.
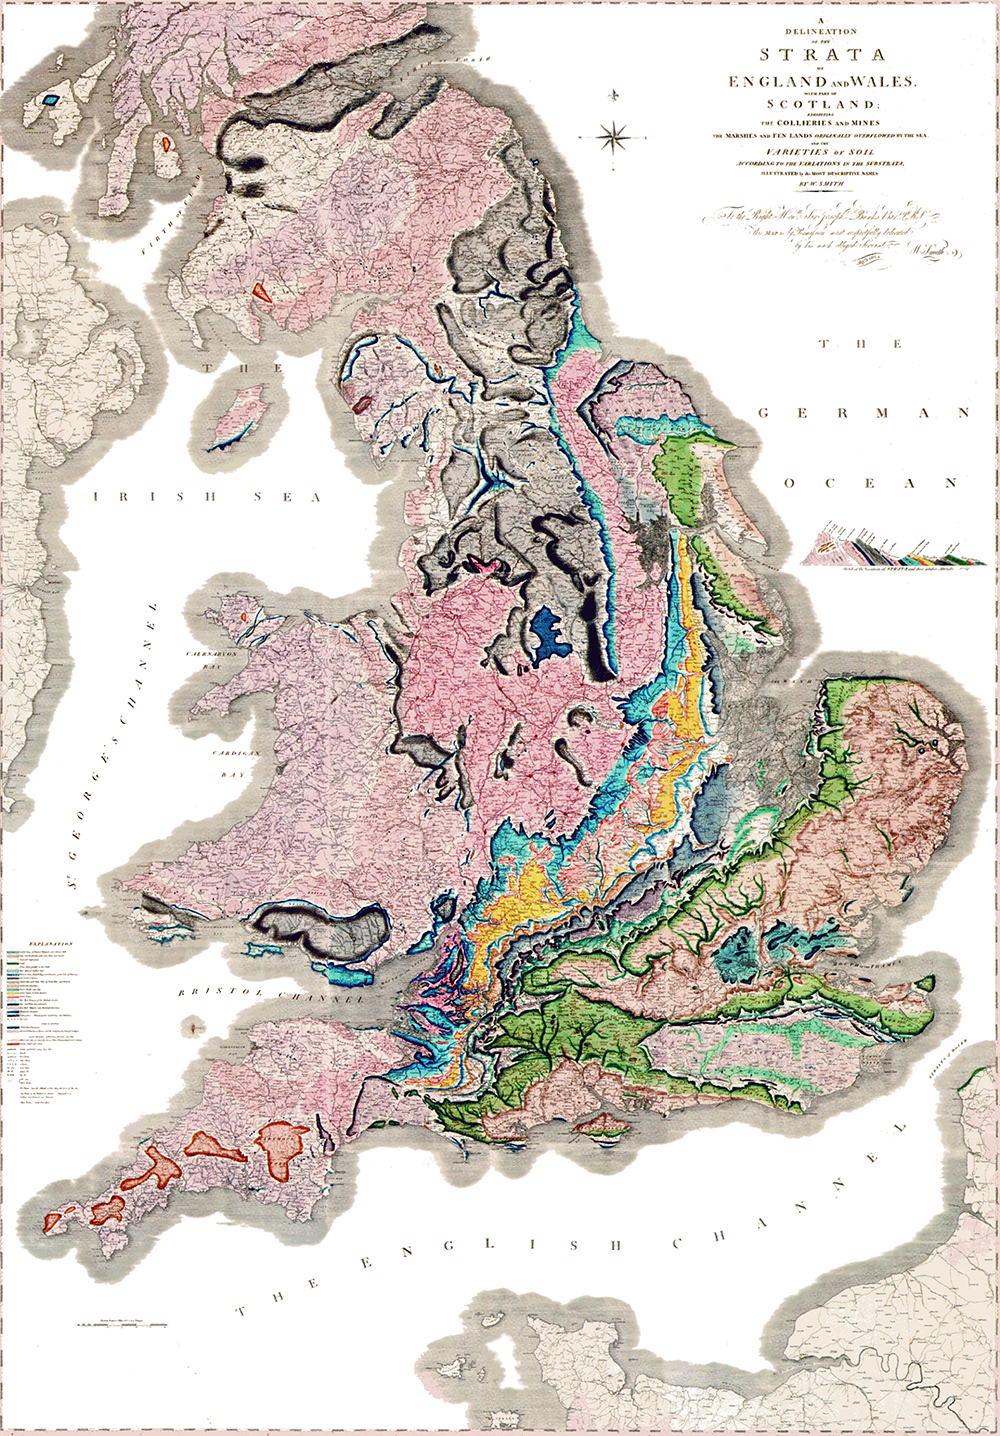
William "Strata" Smith's geological map of England, published in 1815. Image source: WikiMedia Commons (public domain).
Review
Question
What do the different colors on a geological map represent?
Back Title
Rocks of different ages.
Question
Who produced the first geological map of an entire country?
Back Title
William "Strata" Smith.
Question
What do the contour lines on a topographic map represent?
Back Title
Changes in elevation.