

Section contents
Paleoclimate estimation with plant fossils
-
- Nearest living relative methods ←
- Leaf margin analysis (LMA)
Feature image: Fossil palm wood (Palmoxylon). Age and place of origin not specified. Photo by paleobear (flickr, Creative Commons Attribution 2.0 Generic license, image cropped).
Introduction
Nearest living relative (NLR) methods look to the modern world to inform the past. Specifically, NLR methods are used to estimate climate parameters like temperature and precipitation using the assumption of physiological uniformitarianism (see here). Physiological uniformitarianism is the assumption that the climatic and environmental tolerances and requirements of living plants or animals can inform us about the ecological requirements of their extinct relatives. NLR methods may use one or more selected indicator taxa to estimate attributes of paleoclimate, or they may use a more comprehensive approach that includes multiple taxa simultaneously.
Indicator taxa
One approach to nearest living relative analysis of a paleoflora is to look for "indicator taxa," or selected taxa with narrow climatic tolerances that may help limit one or more climate parameters. A common method of using such taxa as indicators is to look for organisms that are cold-sensitive and have little ability to survive frost or freezing. Such taxa help to estimate the absolute lowest temperature that a fossil site may have reached during the winter. They may also provide estimates for the coldest possible cold month mean temperature (CMMT) and mean annual temperature (MAT) for a site.
Wing and Greenwood (1993) named four large groups of frost-intolerant plants that can serve as reliable indicators of warm climate: tree ferns (among living ferns, mostly members of the order Cyatheales), cycads, gingers (the flowering plant family Zingiberaceae), and palms (the flowering plant family Palmae or Arecaceae). These groups have limited cold tolerance due to some shared features. All have large, unprotected apical meristems (growing points at the tips of their stems) that may be damaged by freezing. None typically produces dense wood. In fact, ferns, palms, and gingers do not produce true wood at all. While cycads do produce wood, much of a typical cycad stem is still made up of thin-walled parenchyma cells.
One major drawback of using selected indicator taxa is that they provide very limited climatic information, especially compared to some other approaches for estimating paleoclimate. Additionally, indicator taxa may be misleading if their climatic tolerances have either substantially broadened or narrowed over time (for example, through adaptive radiation or extinction, respectively).
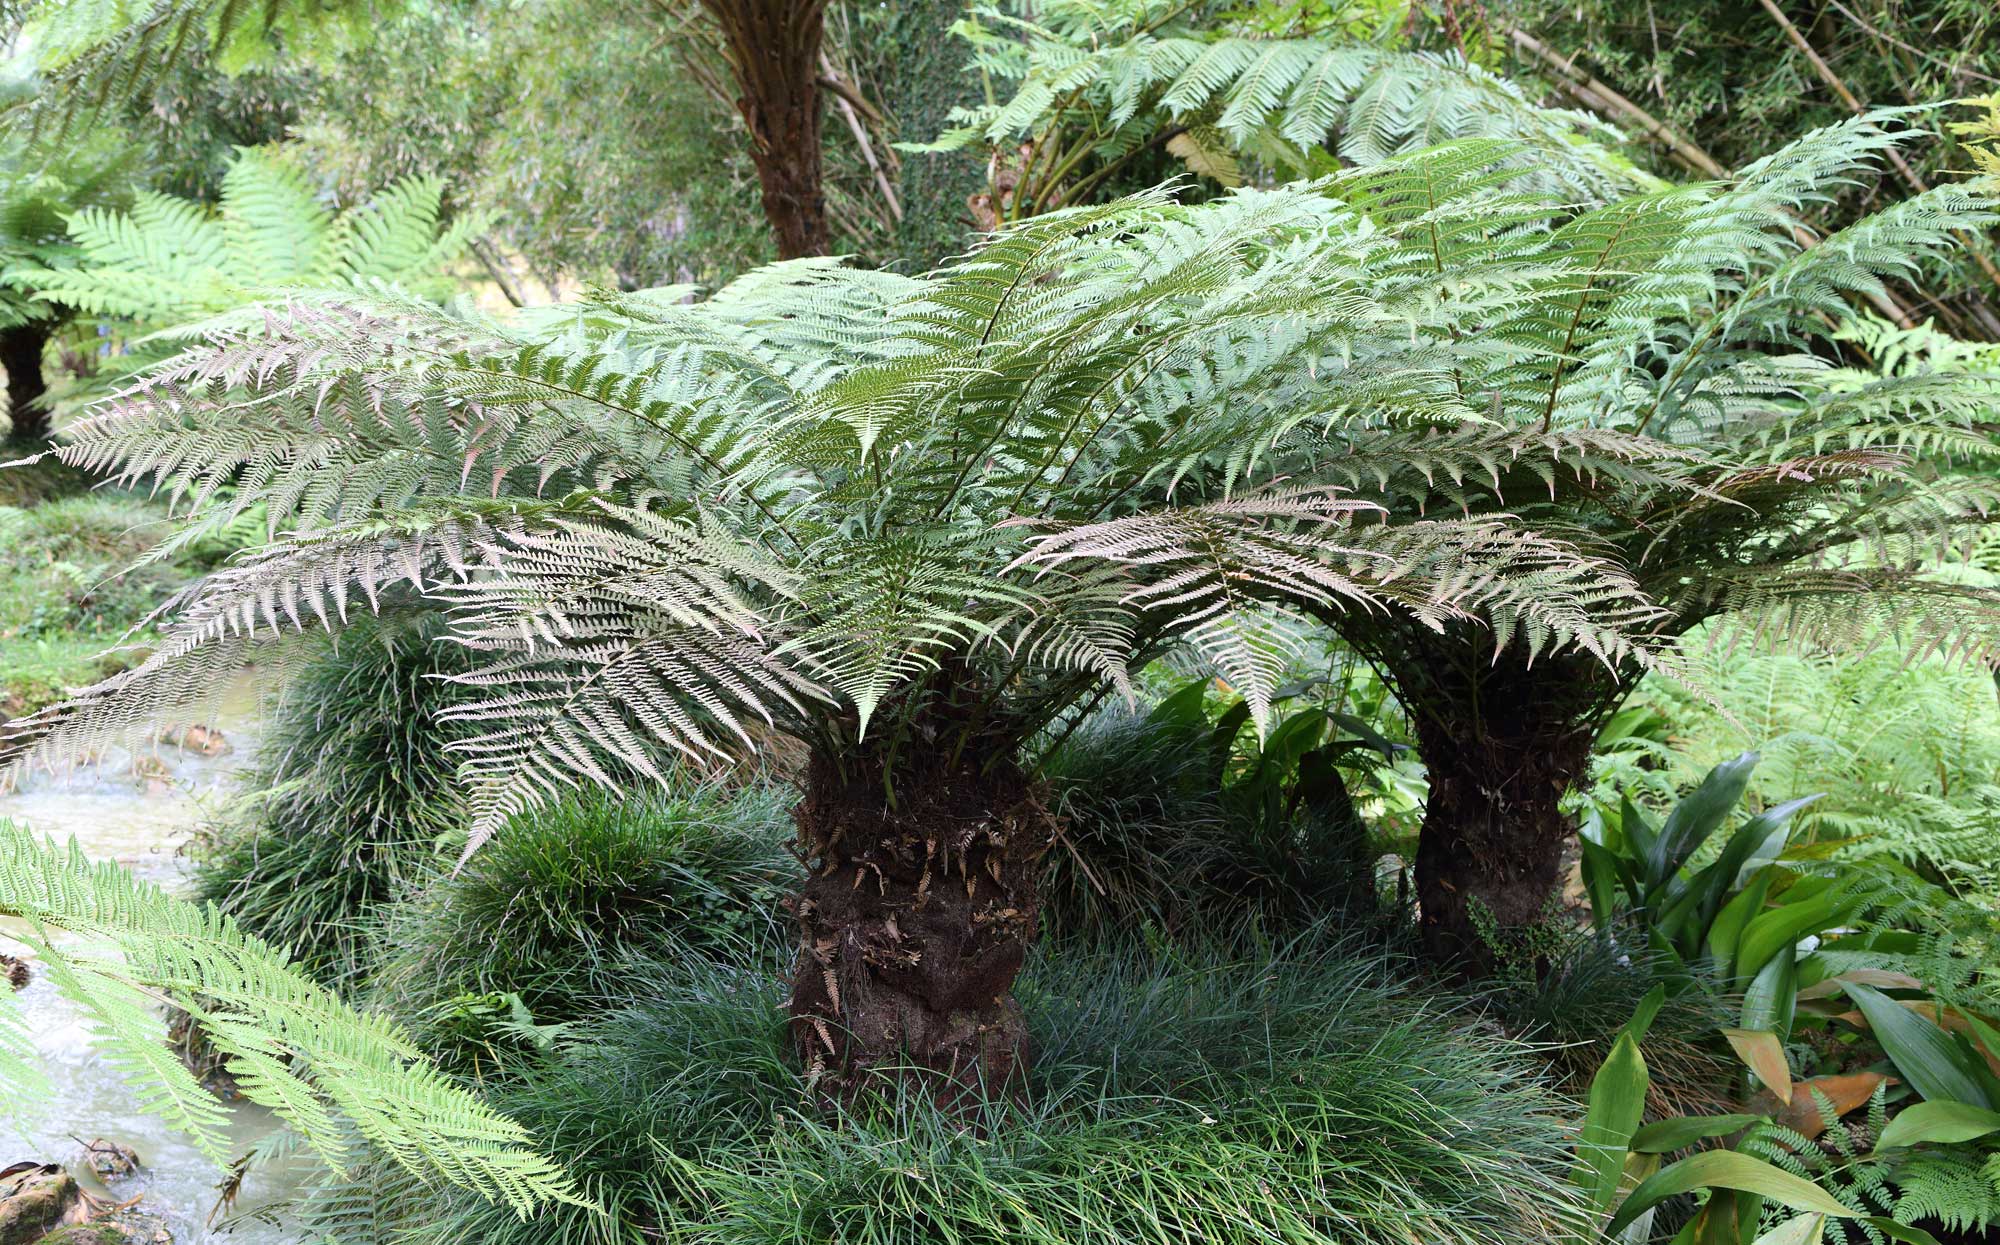
Cultivated golden tree ferns (Dicksonia fibrosa, Dicksoniaceae); these plants are native to New Zealand. Photo by CT Johansson (Wikimedia Commons, Creative Commons Attribution 3.0 Unported license, image cropped and resized).
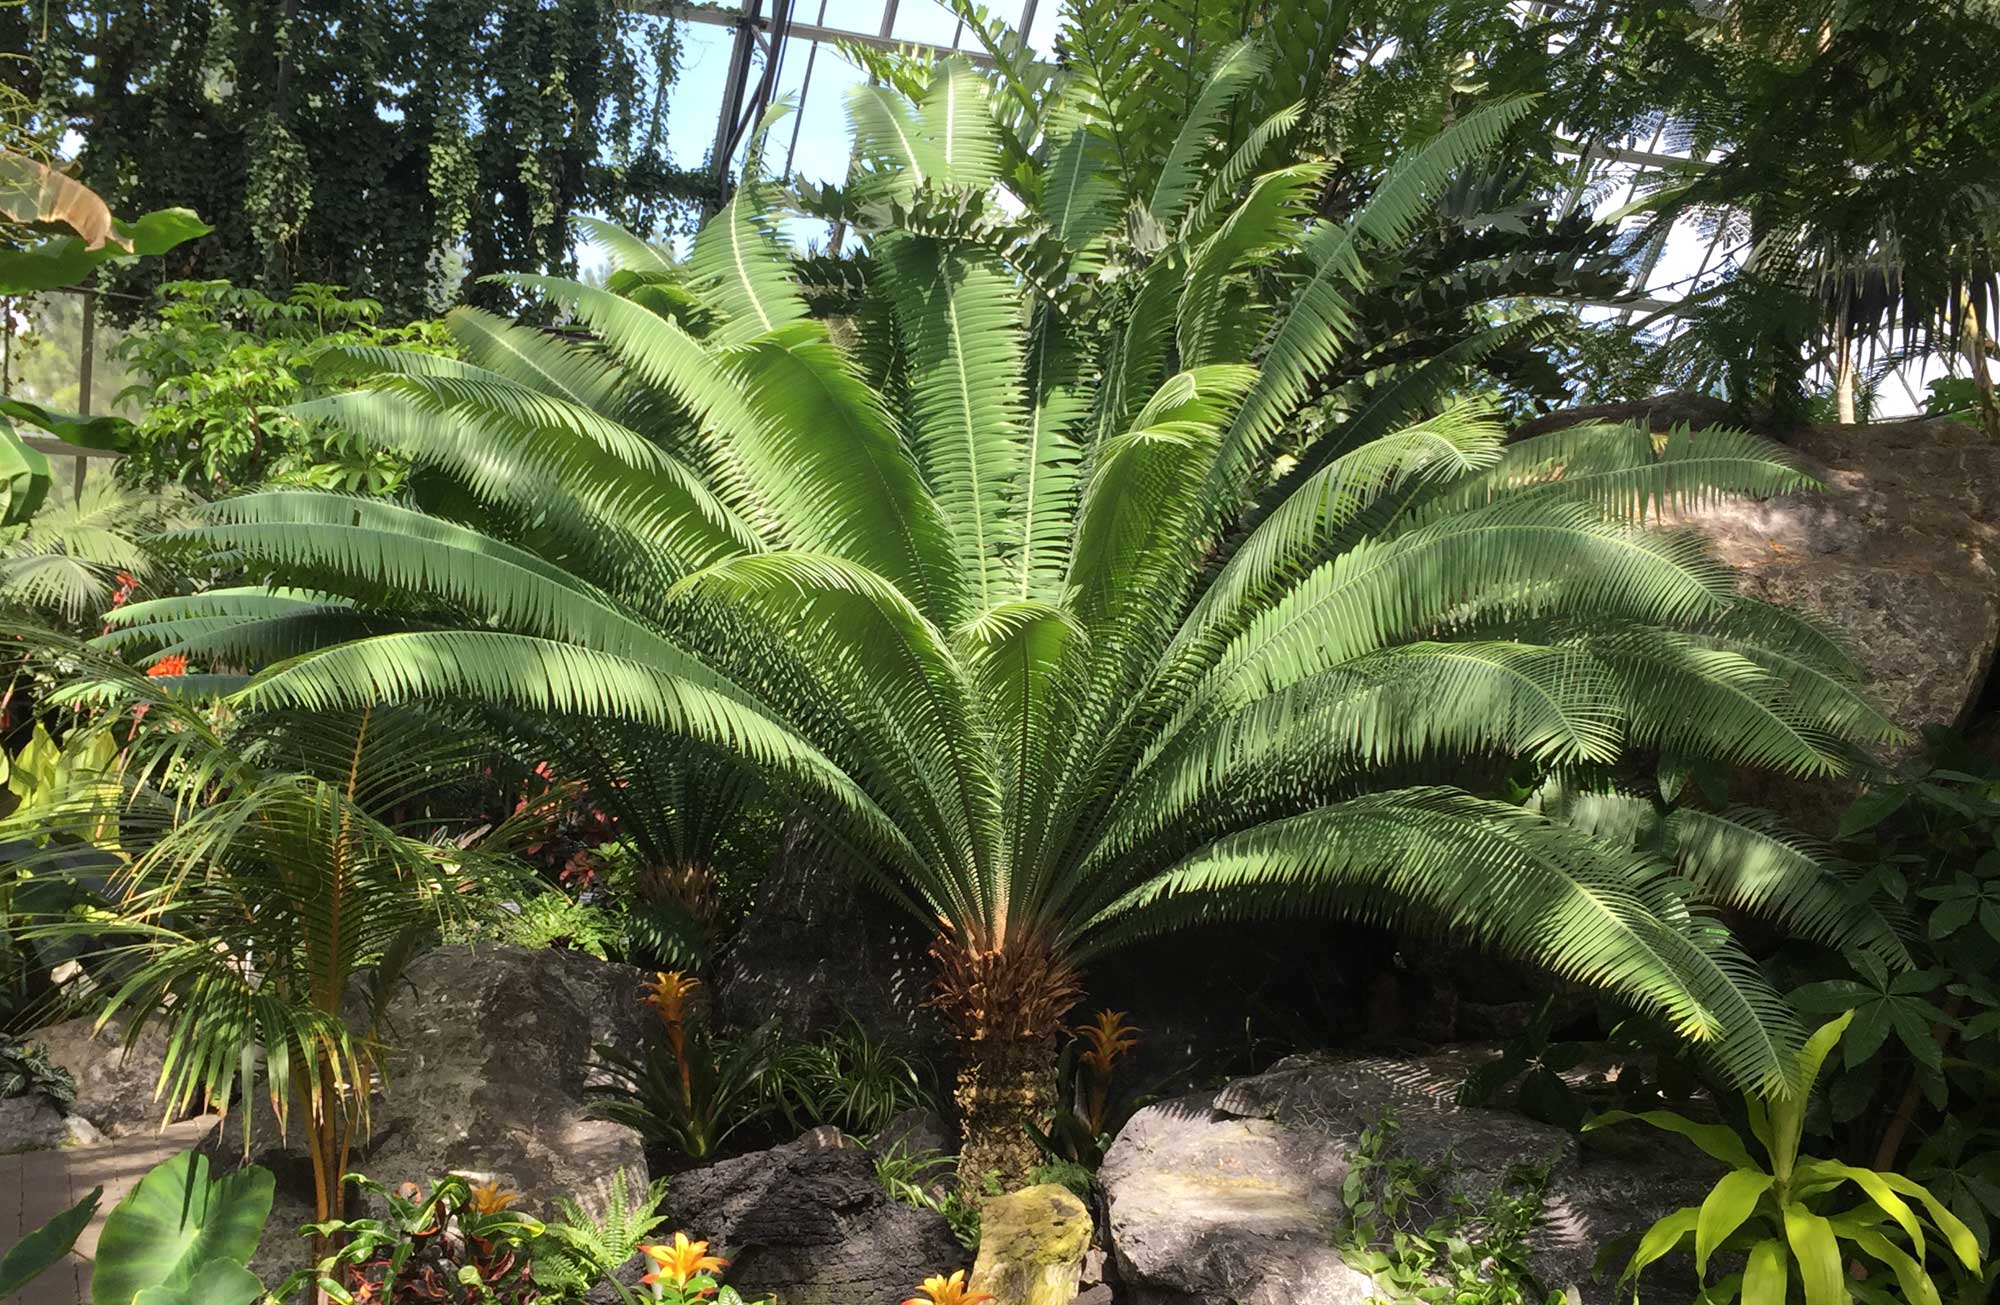
Cultivated giant dioon (Dioon spinulosum), a cycad native to Mexico. Although some cycads have a palm-like growth form, cycads and palms are not closely related. Cycads are gymnosperms (naked-seeded plants) that first appeared in the Paleozoic. Photo by E.J. Hermsen (DEAL).
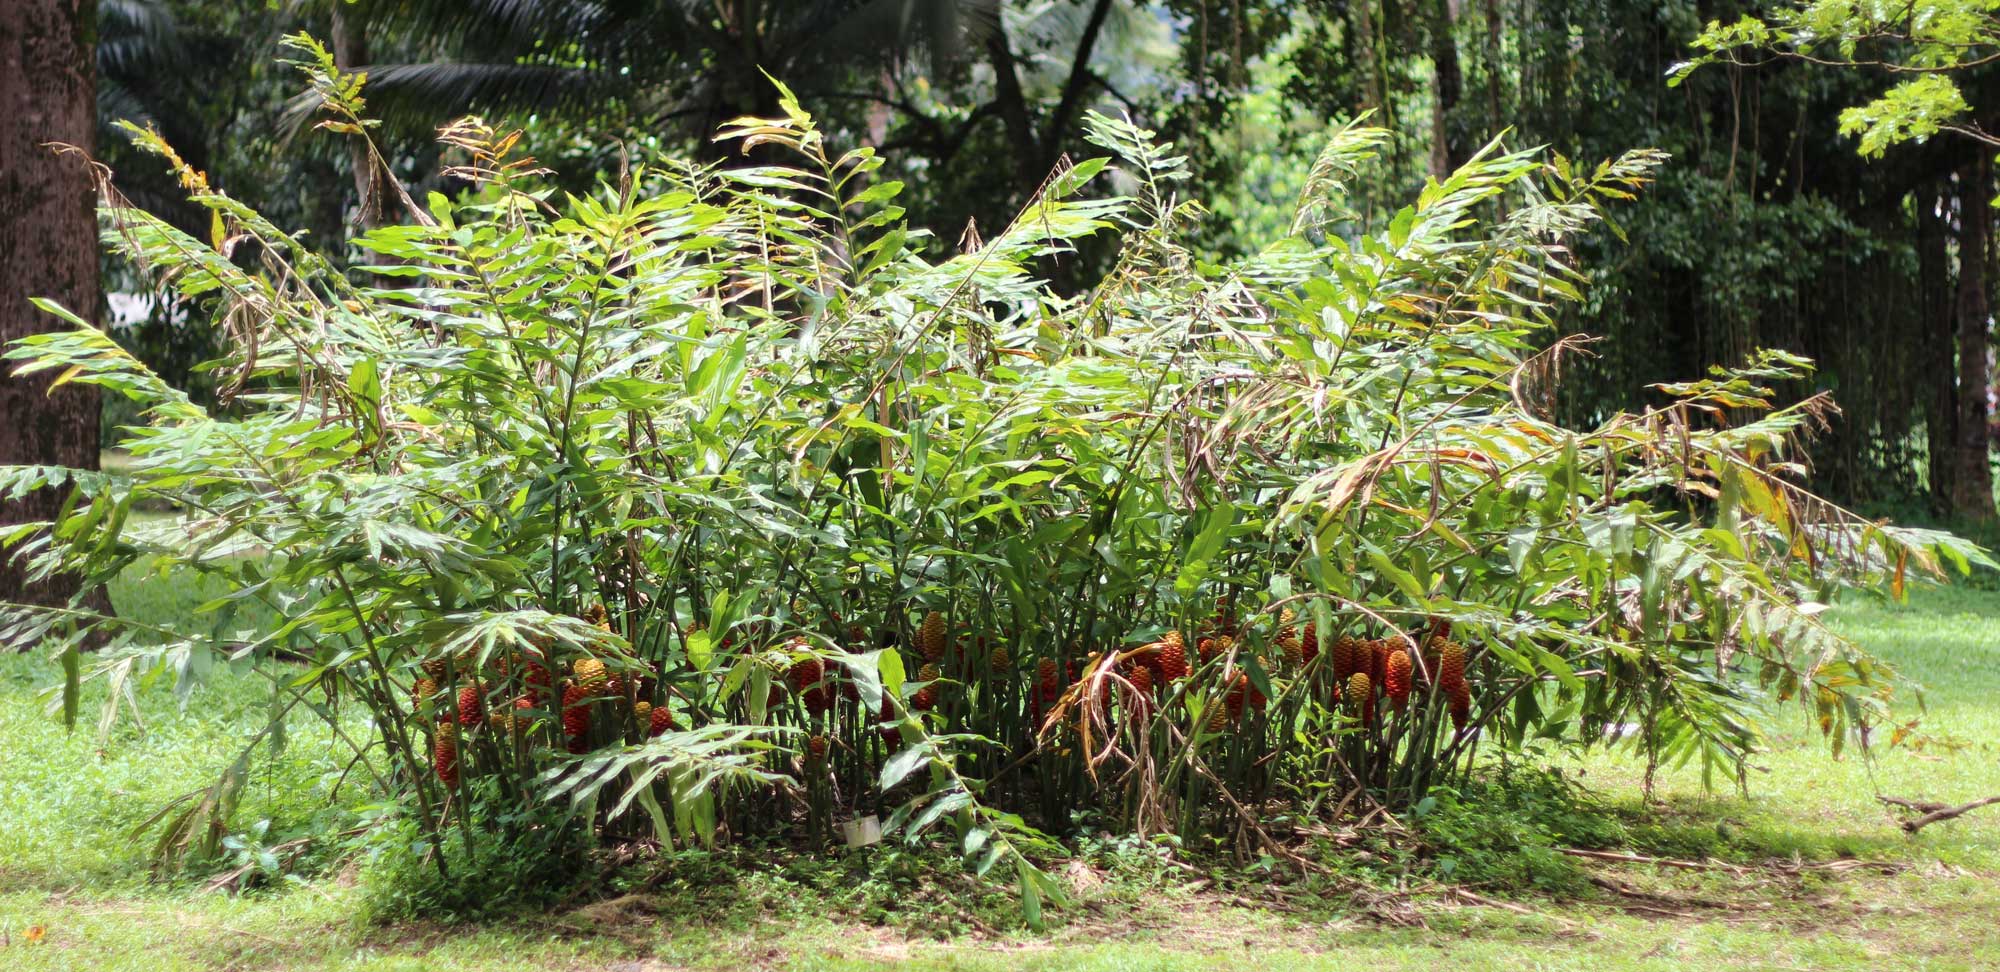
Cultivated Zingiber spectabile, a member of the ginger family (Zingiberaceae) native to Southeast Asia. Photo by GuillaumeG (Wikimedia Commons, Creative Commons Attribution-ShareAlike 4.0 Unported license, image cropped and resized).
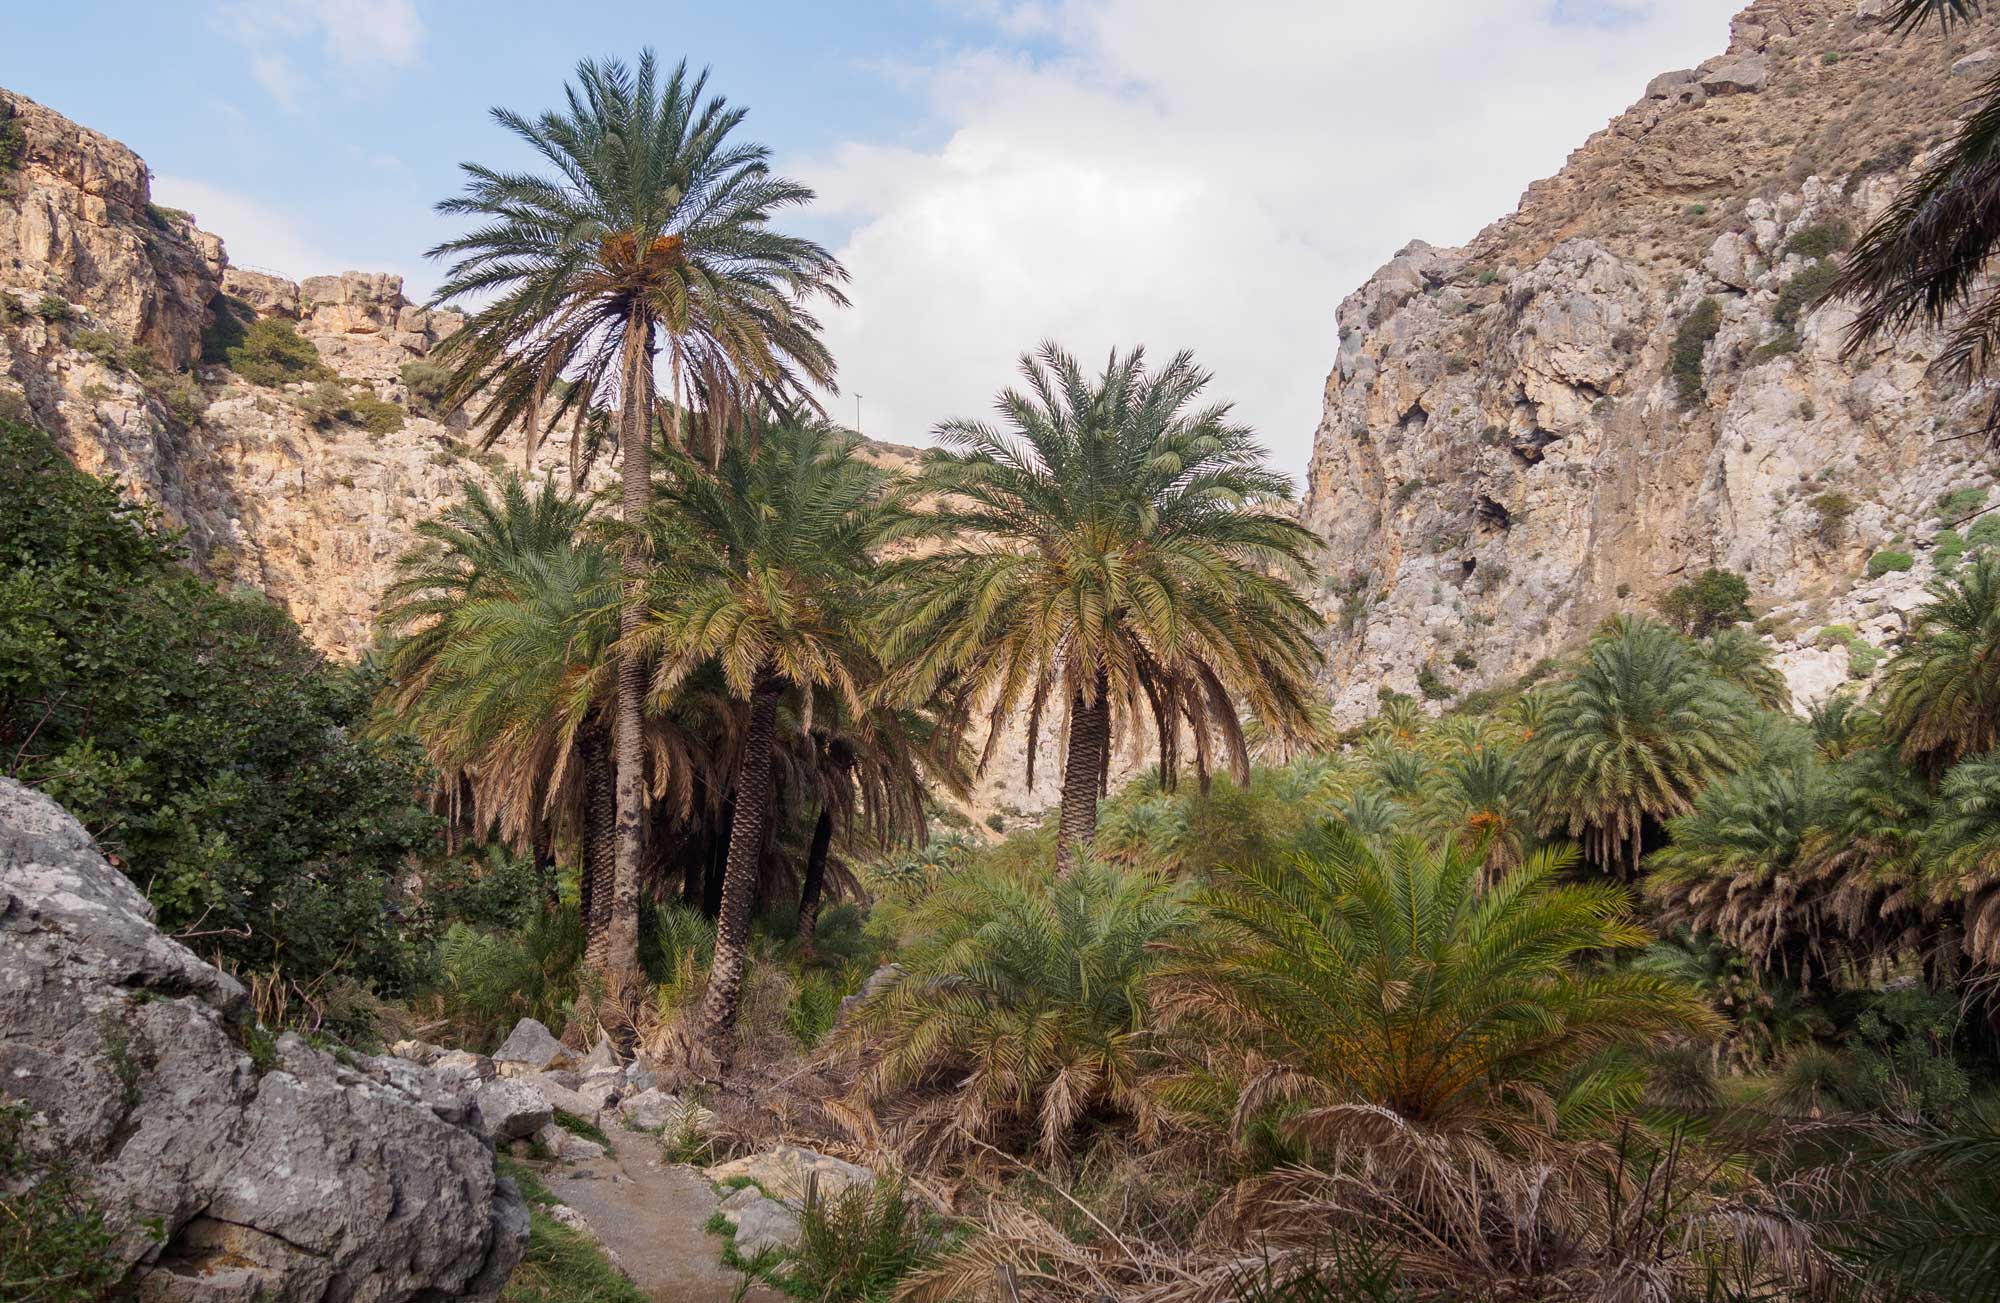
Cretan date palms (Phoenix theophrasti), Preveli Palm Forest, Crete. Photo by C messier (Wikimedia Commons, Creative Commons Attribution-ShareAlike 4.0 International license, image cropped and resized).
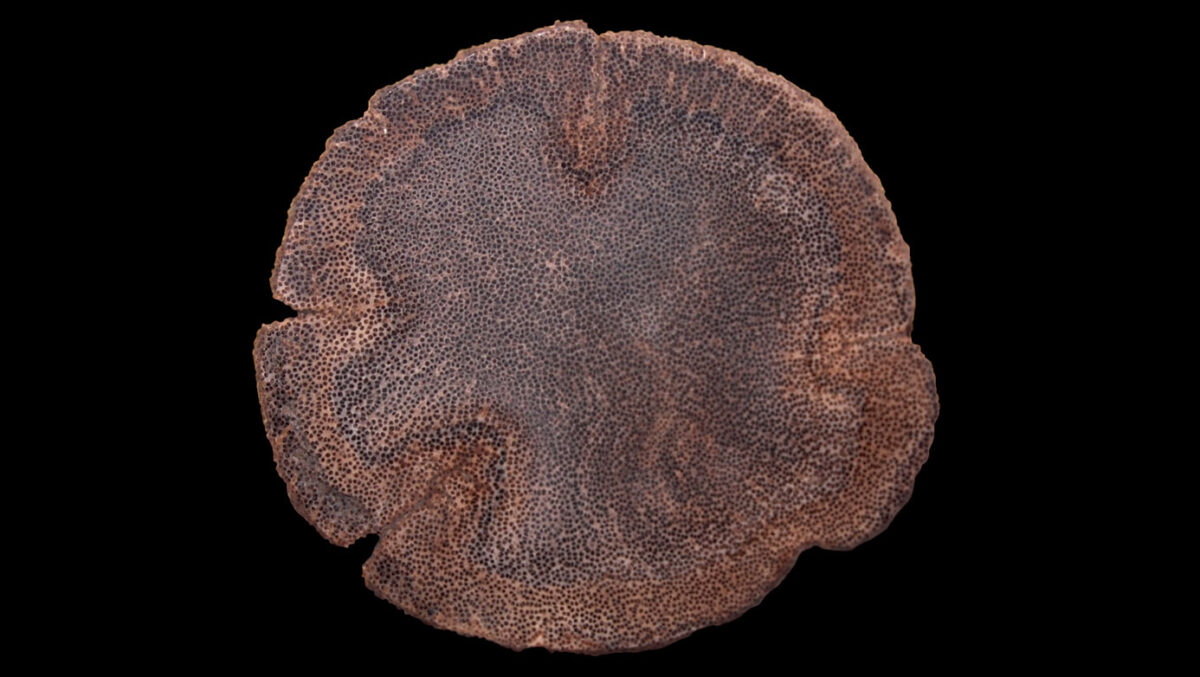
Slab of fossil palm "wood." Transverse section of a portion of a fossil palm stem (Palmoxylon cheyennense, Cretaceous, Pierre Shale, South Dakota, U.S.A.). Palms and other "woody" monocots do not produce true wood. The dots in the palm stem are vascular bundles with associated bundle caps made up of fibers. Credit: Model by Emily Hauf (Digital Atlas of Ancient Life, via Sketchfab, CC BY-SA 4.0).
The palm line
Wing and Greenwood (1993, 1995) defined a "palm line," or a cut-off in temperatures below which palms do not grow. They estimated that the palm line indicates an MAT of at least 10°C (50°F) and a cold month mean temperature (CMMT) of at least 5°C (41°F). A newer, more comprehensive study of the distributions of modern palms has shown that palm climate tolerances vary somewhat. The palm line is approximately correct, however, and a CMMT of just over 5°C is realistic (see here).
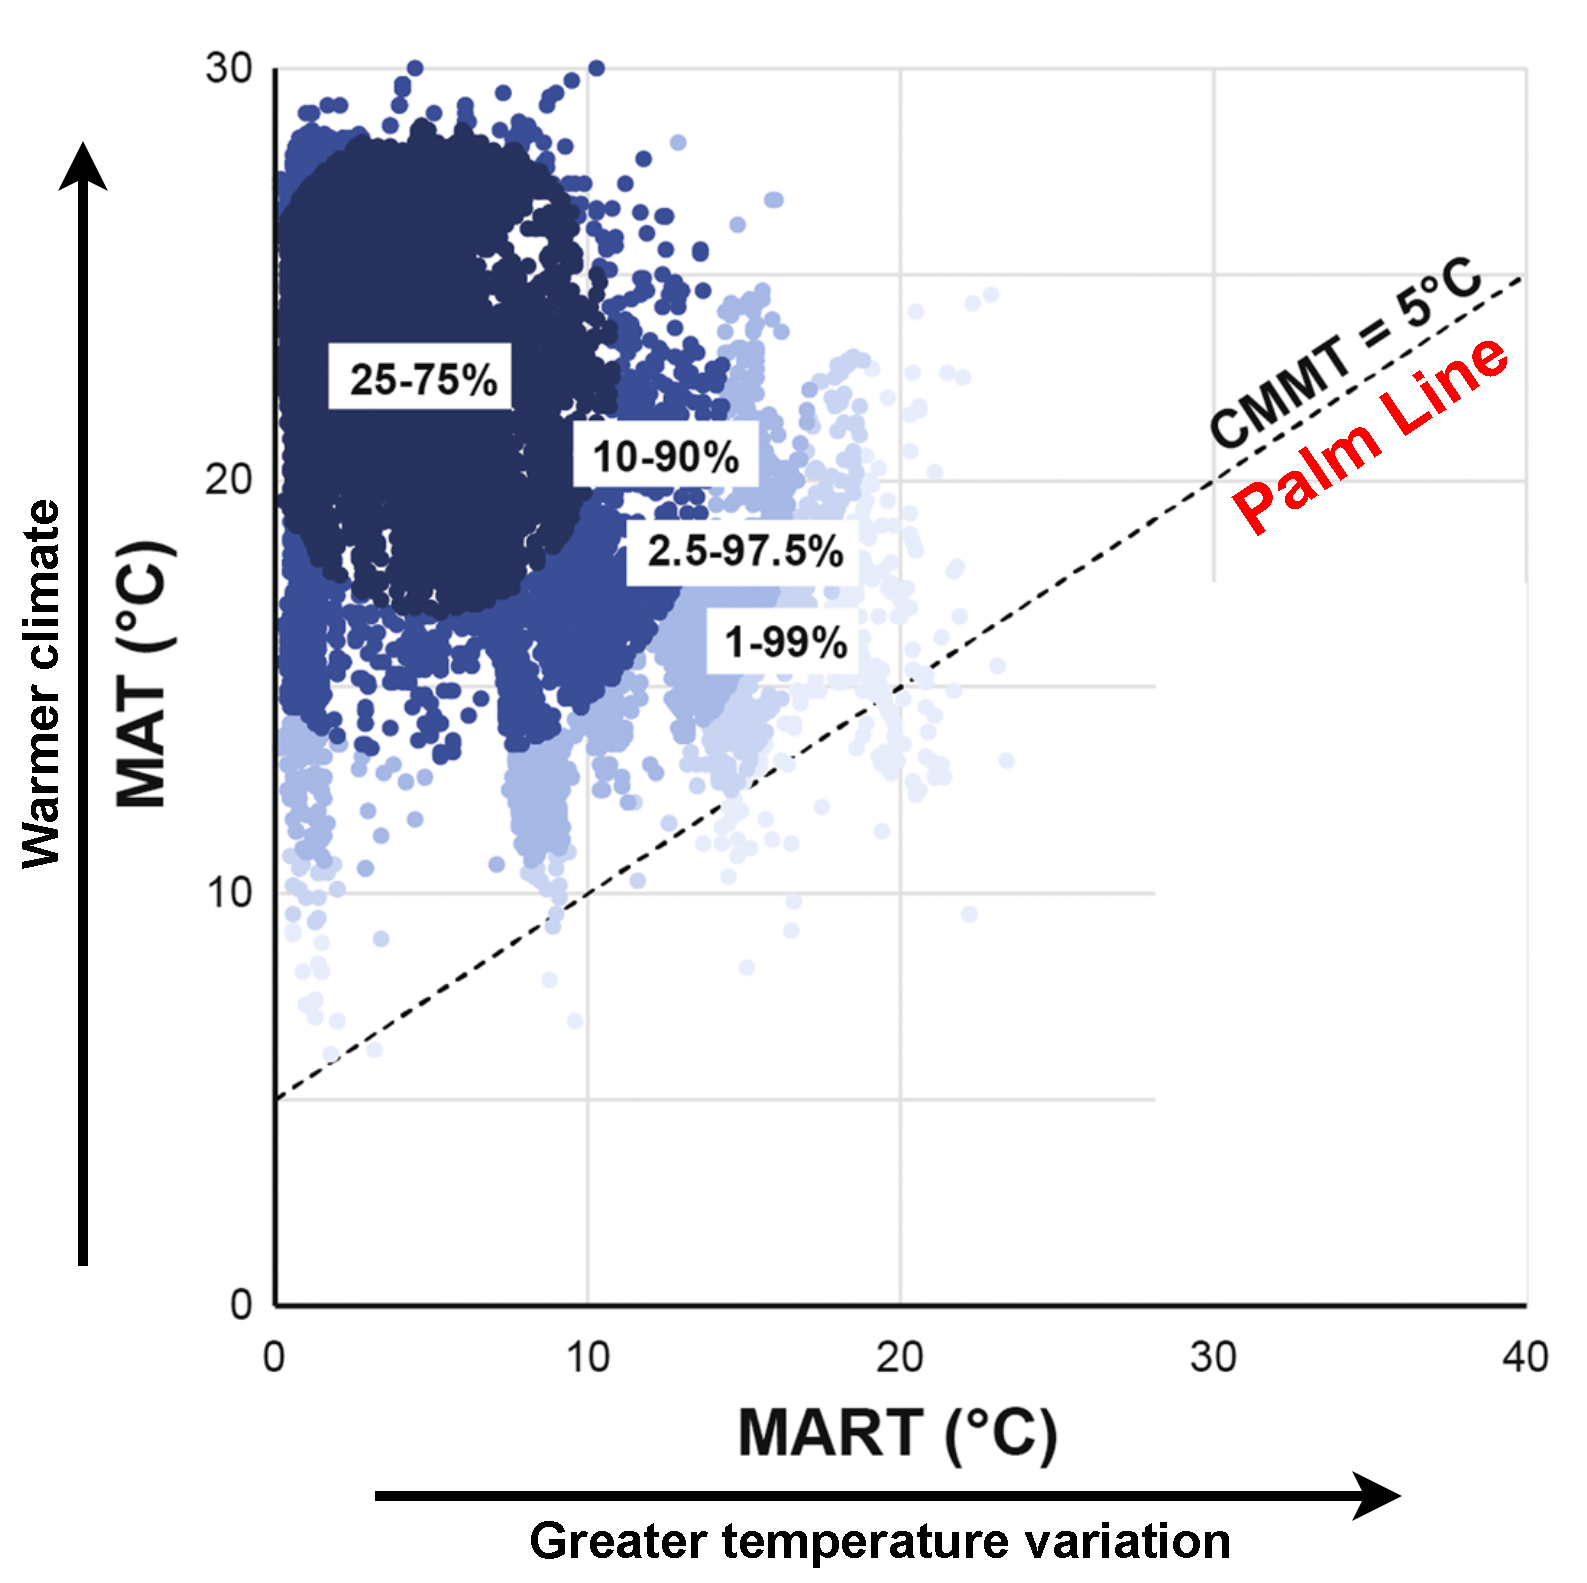
Climatic distribution of modern palms. Graph showing the climate distribution of palms (MAT = mean annual temperature; MART = mean annual range of temperature; CMMT = cold month mean temperature). The darkest blue indicates the core range of palms (50% of occurrences, MAT 18–28°C, MART 0-10°C), with progressively lighter blue indicating progressively more uncommon occurrences. Palms tend to be found most where the temperature is higher and the range of temperature is lower. The dotted diagonal line is approximately the palm line. This line separates environments where the cold month minimum temperature (CMMT) is above 5°C (41°F) from those where the CMMT is below 5°C. Credit: Figured modified from Reichelt et al. (2018) Scientific Reports 8: article 4721, fig. 2 (CC BY 4.0) (some labels added and bar graph removed from lower right corner).
Coexistence approach (CA)
The coexistence approach (proposed by Mosbrugger and Utescher 1997) and the related bioclimatic analysis (proposed by Kershaw and Nix 1988) use the modern climate parameters associated with the nearest living relatives of multiple taxa in a paleoflora to estimate the climate parameters of the paleoflora. In the coexistence approach, the basic procedure is as follows:
- Identify the remains in the fossil flora to the lowest taxonomic level possible.
- Identify the nearest living relative (NLR) for each taxon identified.
- Determine the range of values for the climate parameter of interest for each NLR.
- Determine the coexistence interval (overlap in the range of values for all the NLR's together) for the climate parameter of interest. The coexistence interval is the estimated range of values (minimum–maximum) for a climate parameter for the whole paleoflora.
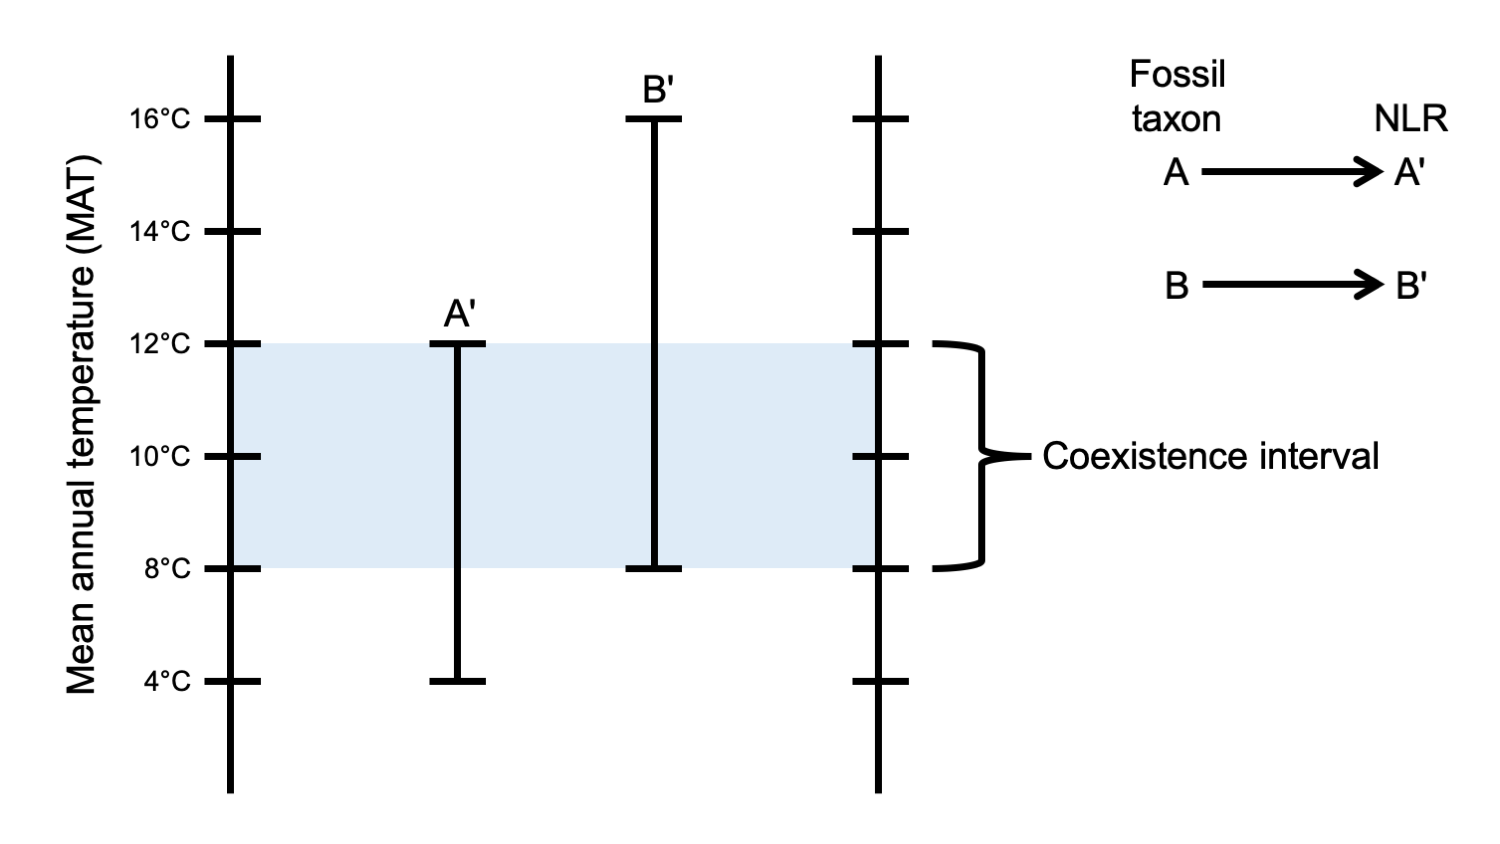
Coexistence interval. The diagram above shows the concept of the interval of coexistence for a two fossil taxa, A and B. The nearest living relatives (NLRs) of A and B are A′ and B′, respectively. By graphing the ranges of mean annual temperature (MAT) over which they occur, we can find the interval of coexistence, or range of MATs in which they overlap. Credit: E.J. Hermsen (DEAL). Diagram after Mosbrugger & Utescher (1997), fig. 1, and Climate Analysis with the Coexistence Approach (author unknown) at neclime.de.
Identifying nearest living relatives (NLRs)
Practically speaking, CA analyses are often done at the genus level. This means that each fossil taxon in an analysis will probably be assigned to the same genus as its NLR. In some cases, the fossil taxon may represent an extinct genus or an organ genus; in this case, the NLR might be the living genus that is thought to be most closely related to the fossil taxon.
Because NLRs are often genera or subgroups within genera, the range of climate parameters assigned to each NLR may encompass multiple living species. Alternatively, a single exemplar species may be chosen to serve as a living proxy for a fossil taxon.
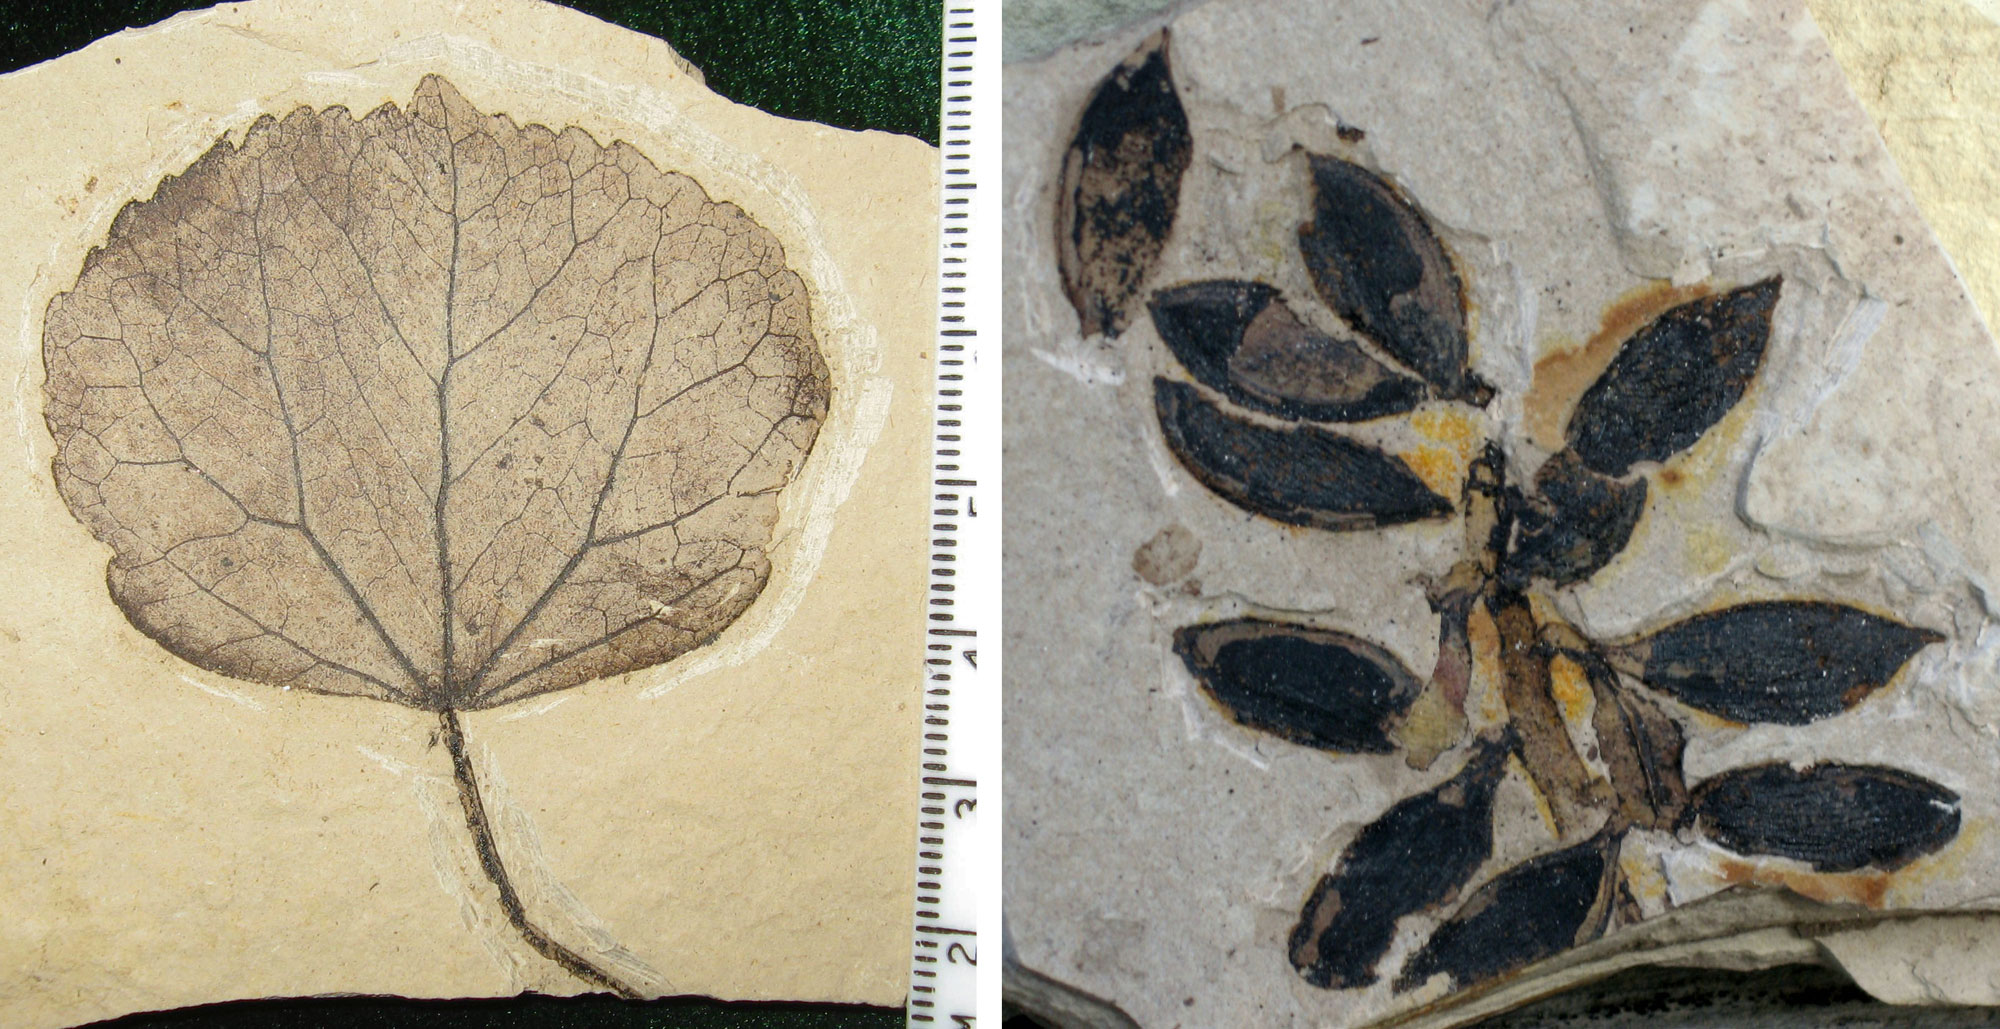
A Cercidiphyllum obtritum leaf (left) and Joffrea-like fruits (right) from the Eocene Republic flora, Ferry County, Washington, U.S.A. These organs may have come from the same species of plant. Whether or not they do, the NLR of both leaves and fruit is modern katsura (Cercidiphyllum), shown below. Left photo and right photo by Kevmin (Wikimedia Commons, Creative Commons Attribution-ShareAlike 4.0 International license, images cropped and resized). Two-panel image originally prepared for Earth@Home by E.J. Hermsen.
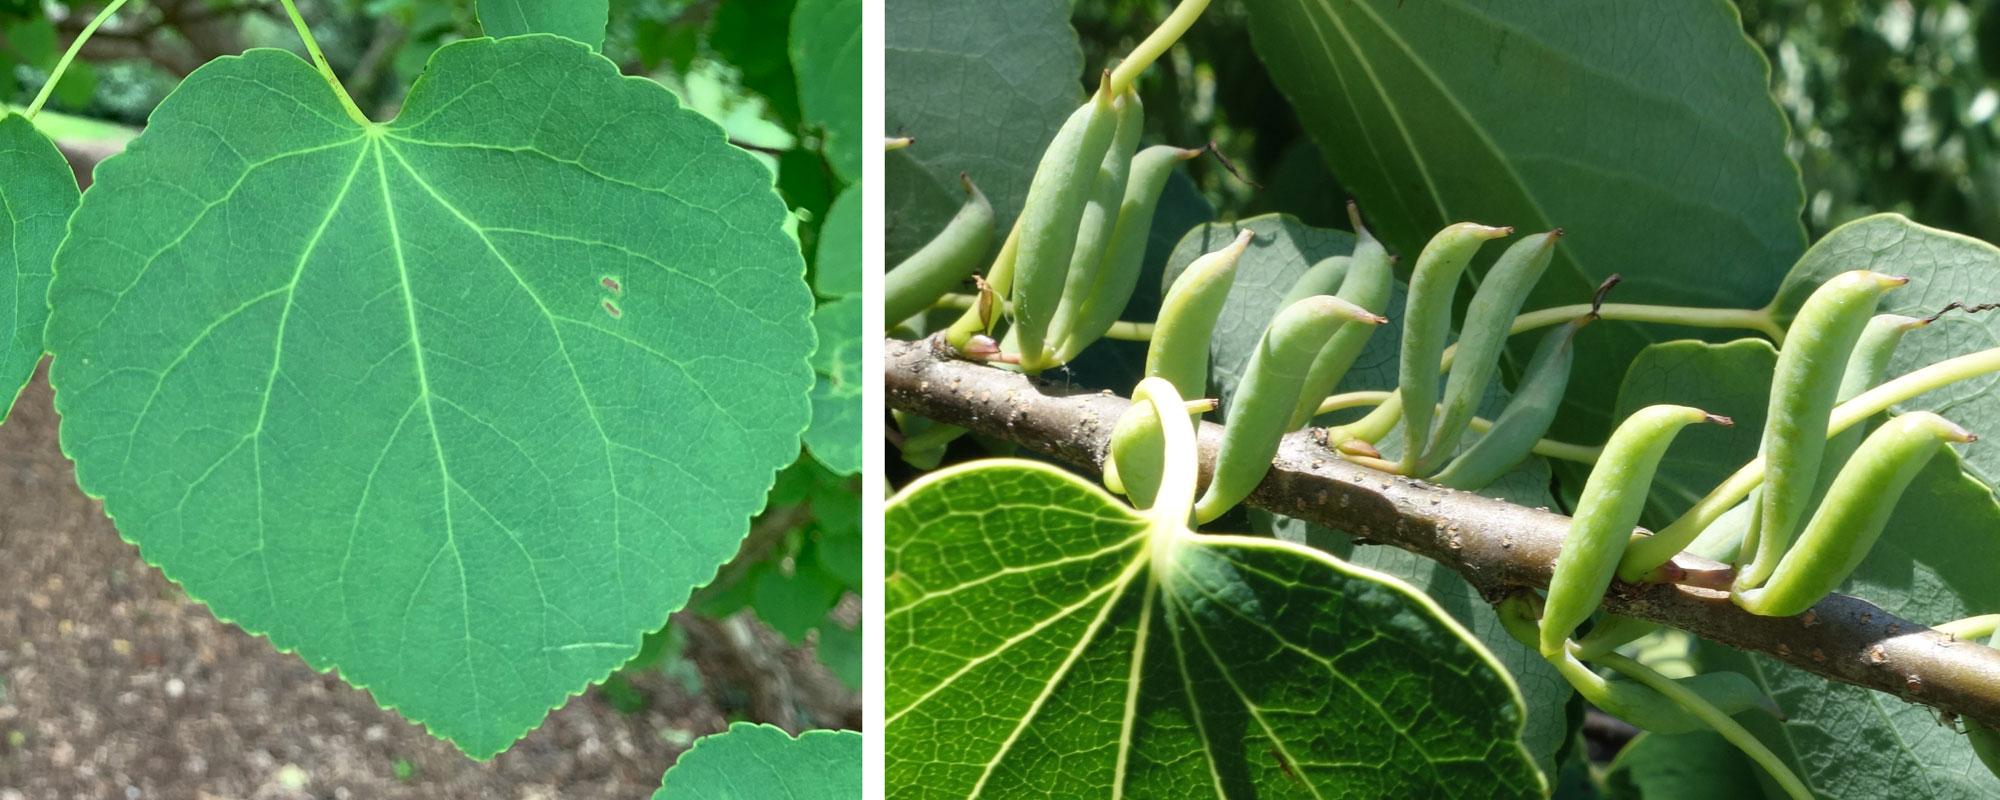
A leaf (left) and fruits (right) of katsura (Cercidiphyllum japonicum). Modern Cercidphyllum includes two species, one from Japan, one from China. Left photo (leaf) by Katherine Wagner-Reiss (Wikimedia Commons, Creative Commons Attribution-ShareAlike 4.0 International license, image cropped and resized); right photo (fruits) by William (Ned) Friedman (Wikimedia Commons, Creative Commons Attribution-ShareAlike 4.0 International license, image cropped and resized).
Where do the climate data come from?
CA analyses utilize databases of modern taxa in order to determine which climate parameters to assign to which NLRs. Notably, these parameters may be estimated from the geographic ranges of the taxa and not from observational or experimental data made on a taxon-by-taxon basis. Thus, it is possible that they do not encompass the full range of environmental tolerances for a given NLR, or that they may misrepresent the climate tolerances. This is one potential source of error in CA and similar types of analyses.
The Palaeoflora database is a database that was designed for CA analysis. It provides information primarily on modern taxa from Eurasia. For floras outside of this region, it may be necessary to compile information taxon-by-taxon.There are many potential sources for geographic distribution and climate data for modern plant taxa, including published papers.
Which climate parameters can be estimated?
At least 10 climate parameters can potentially be estimated using CA. In reality, however, the most commonly estimated paleoclimatic parameters are likely to be temperature and precipitation parameters, especially mean annual temperature (MAT) and mean annual precipitation (MAP). The table below is a list of some of the parameters that are included in the Palaeoflora Database that was built to perform CA analyses.
Selected Climate Parameters that Can Be Estimated Using CA1
| Abbreviation | Parameter |
|---|---|
| MAT | mean annual temperature (°C) |
| CMT (or CCM, CMMT) | cold month mean temperature (°C) |
| WMT (or WMM, WMMT) | warm month mean temperature (°C) |
| MART | mean annual range of temperature (°C) |
| MAP | mean annual precipitation (mm) |
| MARP | mean annual range of temperature |
| RH | relative humidity (%) |
| PE | potential evaporation (mm) |
| AI | aridity index (MAP/PE) |
1After table 1 in Mosbrugger & Utescher (1997) and the Palaeoflora Database.
Outliers
The coexistance approach is not without its critics. Some of the criticisms (such as results being skewed because of bias for or against preservation of some taxa) are commonly raised in paleobiological studies. Other critiques have to do with the assumptions and execution of the method itself.
One difficulty encountered in CA analyses of fossil taxa is the presence of outliers. Outliers are NLRs that have a range of values that does not overlap with the coexistence interval of most other taxa in a CA analysis. There could be several reasons for the presence of outliers. One is that the modern climate data are erroneous or that they do not capture the full potential range of climate variation for the living taxon. Another is that a fossil taxon may be misidentified. Finally, the NLR may be correctly identified and may have adequate climate data for the recent, but may not be an appropriate proxy for its fossil relative.
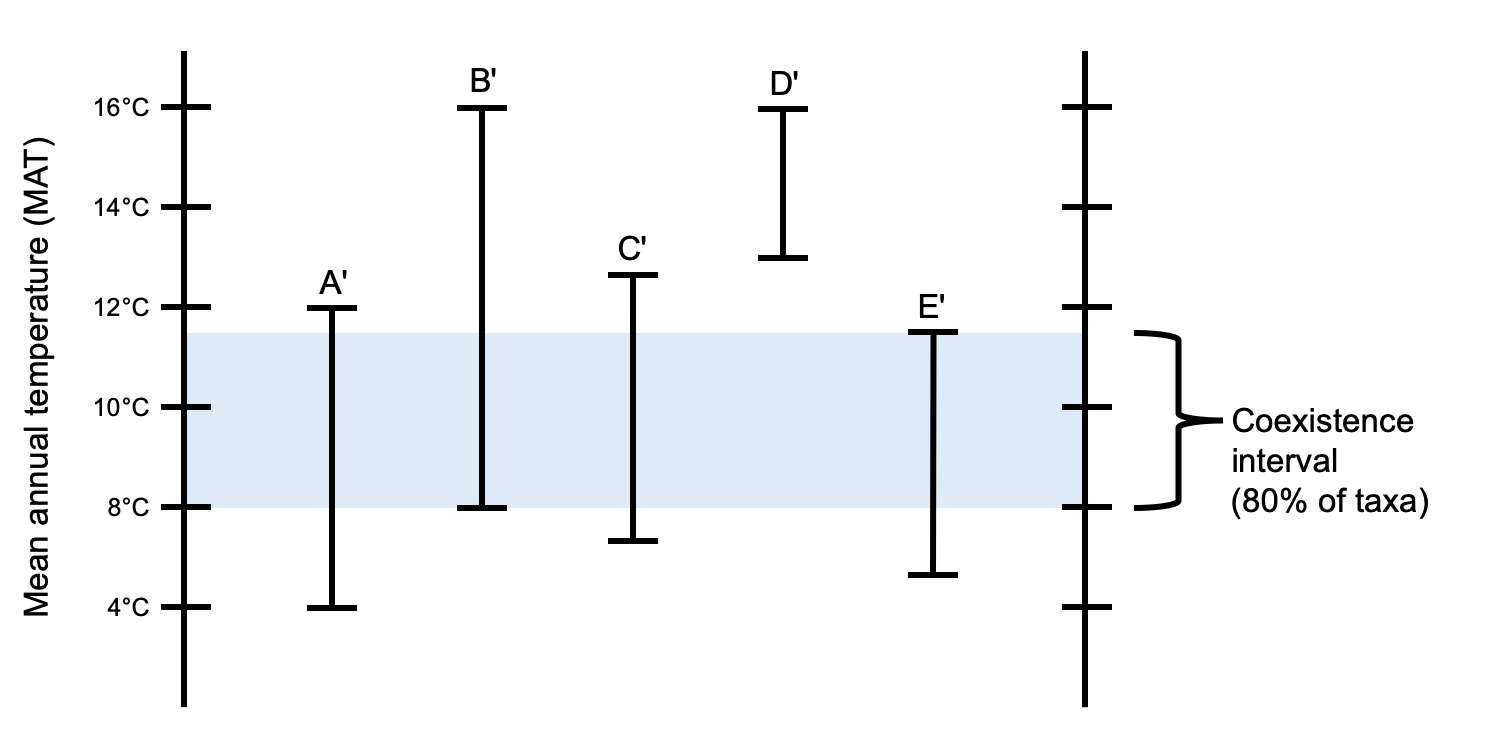
Coexistence analysis with an outlier. The diagram above shows a coexistence analysis of NLRs where one (D′) is a "warm outlier" that has a range for mean annual temperature that does not overlap with the coexistence interval common to the remaining taxa in the analysis. The coexistence interval that encompasses 80% of the taxa (4 out of five) is shown. In this case, it would be ideal to investigate the possible reasons that D′ might be an outlier. Credit: E.J. Hermsen (DEAL).
Some taxa are known to be frequent (or "permanent") outliers in fossil floras of certain ages in certain regions. These permanent outliers have climate ranges that often do not overlap with the common coexistence interval for other taxa present in a fossil flora, thus indicating anomalous temperatures (too warm or too cool) or rainfall (too wet or too dry). Some of these are so-called relicts, which had broader geographic distributions in the past but very restricted distributions today. There is debate about whether it is appropriate to remove outliers from CA analyses.
Utescher et al. (2014) listed some permanent outliers for mid-latitude fossil floras of Europe. One of these, Glyptostrobus (water pine, found today in China and southeast Asia), is a warm outlier in the late Neogene of Europe, meaning that extinct Glyptostrobus species may have lived in cooler climates in the past. Examples of other taxa that are at least sometimes climate outliers in European fossil floras include redwood (Sequoia, native to western California and Oregon today), umbrella pine (Sciadopitys, native to Japan today), and sweet fern (Comptonia, actually a flowering plant native to eastern North America today).
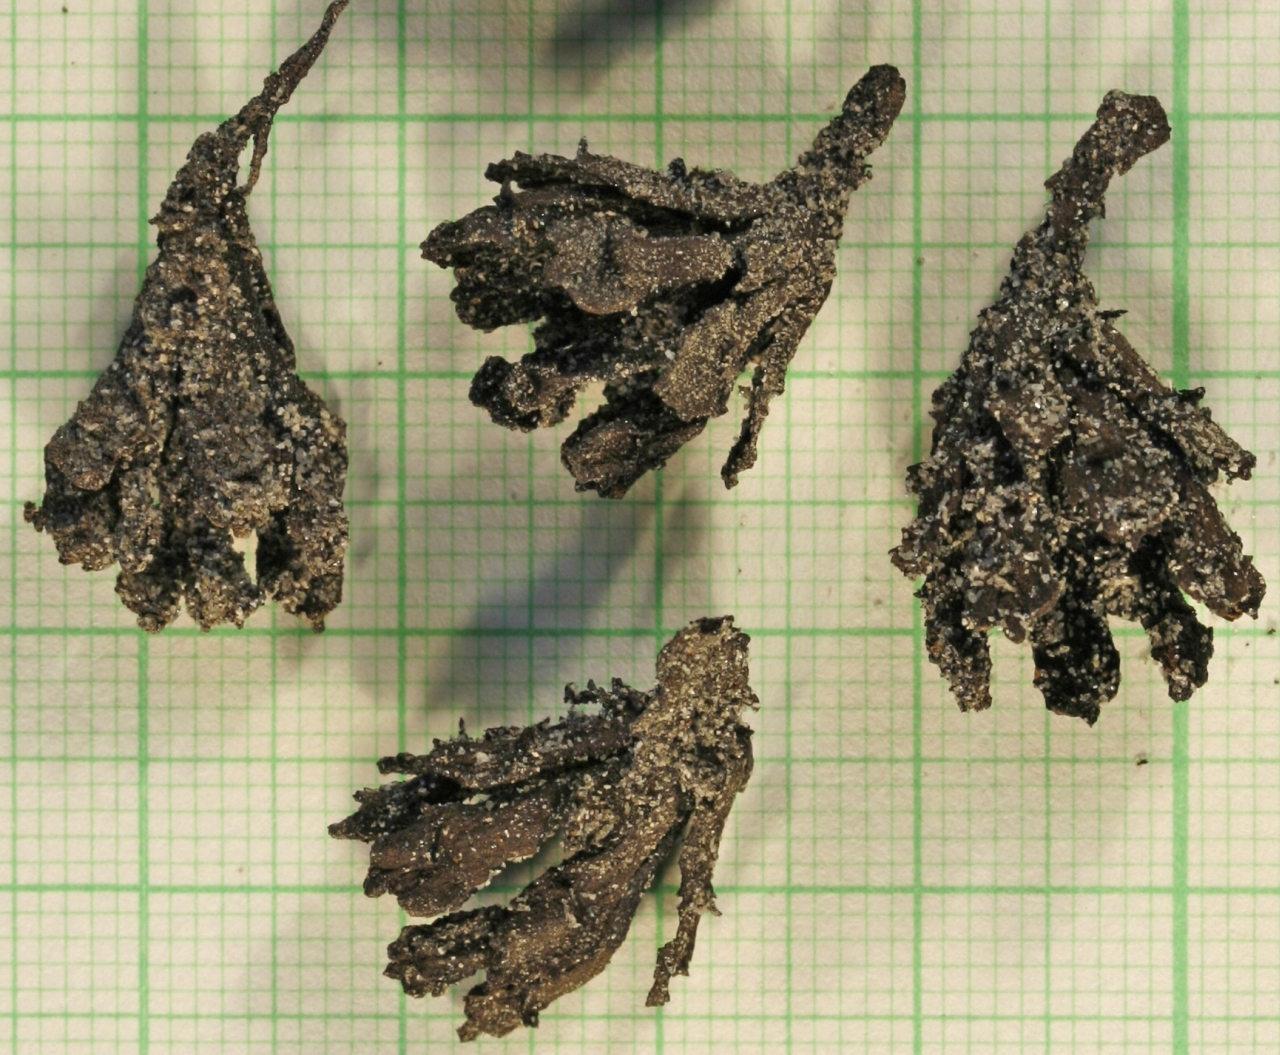
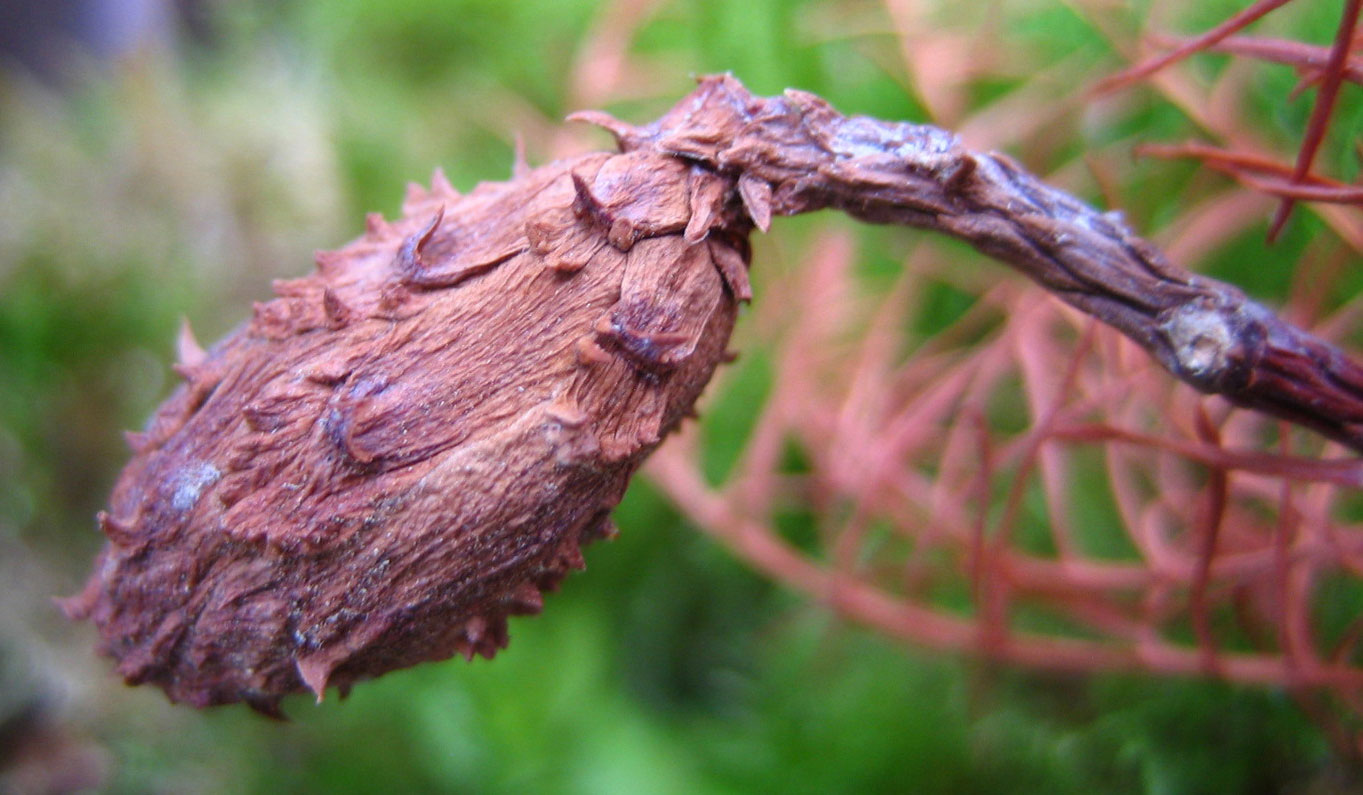
Glyptostrobus sensilis cone. Seed cone on a modern cultivated tree of Glyptostrobus pensilis. Photo by Natacha Frachon (GBIF.org, specimen 19763951 at Royal Botanical Garden Edinburgh, Creative Commons Attribution-Noncommercial 3.0 license, image cropped).
References & further reading
Note: Free full text is made available by the publisher for items marked with a green asterisk.
Online databases
* Global Biodiversity Information Facility (GBIF): https://www.gbif.org/
* Neclime: Neogene Climate Evolution in Eurasia. https://www.neclime.de/
* Palaeoflora: Data base for palaeoclimate reconstructions using the Coexistence Approach. http://www.palaeoflora.de
* WorldClim: https://worldclim.org/
Academic articles & book chapters
* Baumgartner, K.A., and H.W. Meyer. 2014. Coexistence climate analysis of the late Eocene Florissant flora, Colorado. Geological Society of America Abstracts with Programs 46(6): 490. https://gsa.confex.com/gsa/2014AM/webprogram/Paper244071.html
Greenwood, D.R., and S.L. Wing. 2005. Eocene continental climates and latitudinal temperature gradients. Geology 23: 1044–1048.
Greenwood, D.R., S.B. Archibald, R.W. Mathewes, and P.T. Moss. 2005. Fossil biotas from the Okanagan Highlands, southern British Columbia and northeastern Washington State: climates and ecosystems across an Eocene landscape. Canadian Journal of Earth Sciences 42: 167–185. https://doi.org/10.1139/e04-100
Greenwood, D.R., P.T. Moss, A.I. Rowett, A.J. Vadala, and R.L. Keefe. 2003. Plant communities and climate change in southeastern Australia during the early Paleogene. Pp. 365–380. In: S.L. Wing, P.D. Gingerich, B. Schmitz, and E. Thomas, eds. Causes and Consequences of Globally Warm Climates in the Early Paleogene. Geological Society of America Special Paper 369. Boulder, Colorado. https://doi.org/10.1130/0-8137-2369-8.365
* Grimm, G.W., and A.J. Potts. 2015. Fallacies and fantasies: the theoretical underpinning of the Coexistence Approach for palaeoclimate reconstruction. Climate of the Past Discussions 11: 5727–5754. www.clim-past-discuss.net/11/C2884/2016/
Kershaw, A.P. 1997. A bioclimatic analysis of early to middle Miocene brown coal floras, Latrobe Valley, south-eastern Australia. Australian Journal of Botany 45: 373–387. https://doi.org/10.1071/BT96033
Kershaw, A.P., and H.A. Nix. 1988. Quantitative palaeoclimatic estimates from pollen data using bioclimatic profiles of extant taxa. Journal of Biogeography 15: 589–602.
Mosbrugger, V., and T. Utescher. 1997. The coexistence approach—a method for quantitative reconstructions of Tertiary terrestrial palaeoclimate data using plant fossils. Palaeogeography, Palaeoclimatology, Palaeoecology 134: 61–86. https://doi.org/10.1016/S0031-0182(96)00154-X
* Peppe, D.J., A. Baumgartner, A. Flynn, and B. Blonder. 2017. Reconstructing paleoclimate and paleoecology using fossil leaves, ver. 2. PaleorXiv. https://doi.org/10.31233/osf.io/stzuc
Peppe, D.J., A. Baumgartner, A. Flynn, and B. Blonder. 2018. Reconstructing paleoclimate and paleoecology using fossil leaves. Pp. 289–317. In: D.A. Croft, D.F. Su, and S.W. Simpson, eds. Methods in Paleoecology: Reconstructing Cenozoic Terrestrial Environments. Springer Nature Switzerland AG, Switzerland. https://doi.org/10.1007/978-3-319-94265-0_13
* Reichgelt, T., C.K. West, and D.R. Greenwood. 2018. The relation between global palm distribution and climate. Scientific Reports 8, article 4721. https://doi.org/10.1038/s41598-018-23147-2
* Stults, D.Z., and B. Axsmith. 2015. New plant fossil records and paleoclimate analyses of the late Pliocene Citronelle Formation flora, U.S. Gulf Coast. Palaeontologia Electronica 18.3.47A: 1–35. https://doi.org/10.26879/550
Tiffney, B.H. 2008. Phylogeoraphy, fossils, and northern hemisphere biogeography: The role of physiological uniformitarianism. Annals of the Missouri Botanical Garden 95: 135–143. https://doi.org/10.3417/2006199
Uhl, D., V. Mosbrugger, A. Bruch, and T. Utescher. 2003. Reconstructing palaeotemperatures using leaf floras—case studies for a comparison of leaf margin analysis and the coexistence approach. Review of Palaeobotany and Palynology 126: 49–64. https://doi.org/10.1016/S0034-6667(03)00058-7
Utescher, T., A.A. Bruch, B. Erdei, L. François, D. Ivanov, F.M.B. Jacques, A.K. Kern, Y.-S.(C.) Liu, V. Mosbrugger, and R.A. Spicer. 2014. The Coexistence Approach—Theoretical background and practical considerations of using plant fossils for climate quantification. Palaeogeography, Palaeoclimatology, Palaecology 410: 58–73. https://doi.org/10.1016/j.palaeo.2014.05.031
Wing, S.L., and D.R.Greenwood. 1993. Fossils and fossil climate: The case for equable continental interiors in the Eocene. Philosophical Transactions: Biological Sciences 341: 243–252. https://doi.org/10.1098/rstb.1993.0109
Zaborac-Reed, S., and E.B. Leopold. 2016. Determining the paleoclimate and elevation of the late Eocene Florissant flora: support from the coexistence approach. Canadian Journal of Earth Sciences 53: 565–573. https://doi.org/10.1139/cjes-2015-0165
Content usage
Usage of text and images created for DEAL: Text on this page was written by Elizabeth J. Hermsen. Original written content created by E.J. Hermsen for the Digital Encyclopedia of Ancient Life that appears on this page is licensed under a Creative Commons Attribution-NonCommercial-ShareAlike 4.0 International License. Original images created by E.J. Hermsen are also licensed under Creative Commons Attribution-NonCommercial-ShareAlike 4.0 International License.
Content sourced from other websites: Attribution, source webpage, and licensing information or terms of use are indicated for images sourced from other websites in the figure caption below the relevant image. See original sources for further details. Attribution and source webpage are indicated for embedded videos. See original sources for terms of use. Reproduction of an image or video on this page does not imply endorsement by the author, creator, source website, publisher, and/or copyright holder.
Adapted images. Images that have been adapted or remixed for DEAL (e.g., labelled images, multipanel figures) are governed by the terms of the original image license(s) covering attribution, general reuse, and commercial reuse. DEAL places no further restrictions above or beyond those of the original creator(s) and/or copyright holder(s) on adapted images, although we ask that you credit DEAL if reusing an adapted image from the DEAL website. Please note that some DEAL figures may only be reused with permission of the creator(s) or copyright holder(s) of the original images. Consult the individual image credits for further details.
Last updated 12 August 2022.