
Chapter contents:
Conservation Paleobiology
– 1. Foundations in Conservation Biology
– 2. Approaches in Conservation Paleobiology
–– 2.1 Near-time Approaches
–– 2.2 Deep-time Approaches
– 3. Deliverables from Conservation Paleobiology ←
– 4. Barriers to Applying Conservation Paleobiology
Above image by Jansen Smith.
Deliverables
Conservation paleobiology can provide data to address a wide range of conservation issues. In their review of the field, Dietl et al. (2015) identified thirteen unique deliverables from conservation paleobiology. Here we will take a look at these deliverables with an emphasis on how data from geohistorical records can inform the decision-making process.
1. Identifying non-native species
Non-native species have been a prominent concern in conservation biology, particularly when the goal of conservation efforts has been to maintain ecosystems with high historical fidelity (i.e., without non-natives present). In pursuit of this goal, geohistorical records are highly useful. As discussed in the opening section (Conservation Paleobiology), pollen records have been studied in the Galápagos to determine the status of several plant species on the islands. The pollen record showed that the six species being studied were, in fact, native to the Galápagos Islands. In many ways, it is easier to identify a species as native, rather than non-native, because presence in the geohistorical record is often sufficient evidence. Proving the absence of something can be more challenging, as alternative reasons for a species absence must also be ruled out.
Working in the Colorado River estuary, in the northern Gulf of California (Mexico), Smith and Dietl (2016) used accumulations of dead shells to identify a non-native species. Examining thousands of seashells from the last several thousand years, they noted the absence of the predatory snail Notocochlis chemnitzii (learn more about naticid paleoecology) from those assemblages but, when examining freshly dead shells on the tidal flat, found an numerous individuals of this new snail. Before declaring the Notocochlis as non-native, they also considered alternative explanations. For example, was it possible that taphonomic processes removed all the Notocochlis shells? This was unlikely as a highly similar species, Polinices reclusiana, was abundant in the old and new accumulations. After ruling out all potential alternative explanations, Smith and Dietl concluded that the Notocochlis population was new to the estuary.
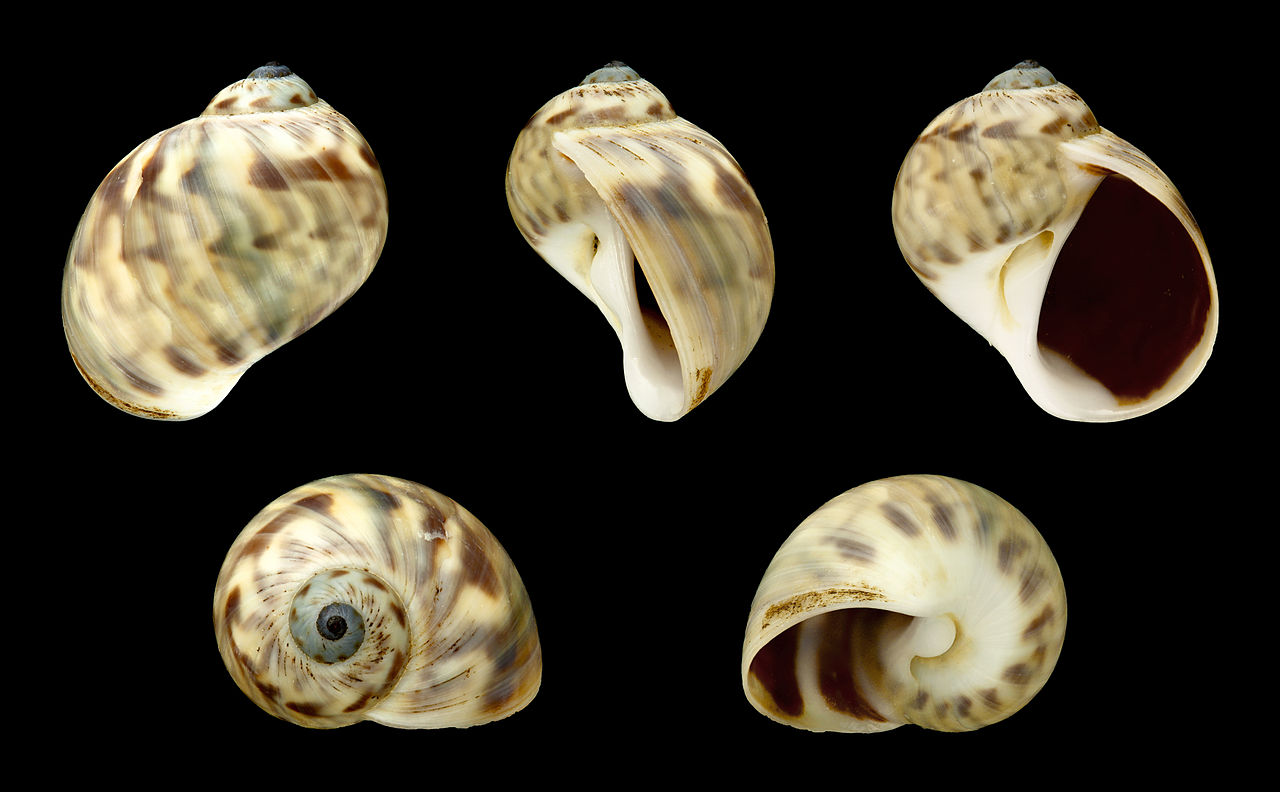
Specimens of the naticid snail Notocochlis chemnitzii, which has recently extended its range into the Colorado River estuary. Image by H. Zell; GNU Free Documentation License.
2. Measuring historical variability
Ecosystems naturally fluctuate over time and it is important to account for this natural variability when setting restoration goals. Many restoration efforts are based on static points in time, but geohistorical records provide a means to improve these baselines by incorporating natural dynamism of ecosystems into the decision-making process. Our understanding of current climate change provides a good example.
Although we have known for decades (and arguably centuries) that greenhouse gases are accumulating in the atmosphere and are responsible for warming the climate, we would not have a way to contextualize these changes without geohistorical records. Direct measurements of temperatures only include the last several hundred years. By contrast, records reconstructed from ice cores taken out of Antarctica give us an 800,000-year history of climate on Earth (learn more about ice cores and paleoenvironmental reconstruction). These records show that concentrations of carbon dioxide in the atmosphere have cycled from 180 to 280 ppm on a 100,000-year cycle. Today, concentrations exceed 410 ppm. Using a static baseline from direct measurement, we would only be able to extend the record to the 1950s, when the first atmospheric carbon dioxide measurements were taken. The early measurements showed concentrations around 315 ppm. Using only these measures, we would still know that concentrations have been increasing, but it is the comparison to the last hundreds of thousands of years that show the dramatic change that is occurring. We have strayed well outside of the natural range of variability.
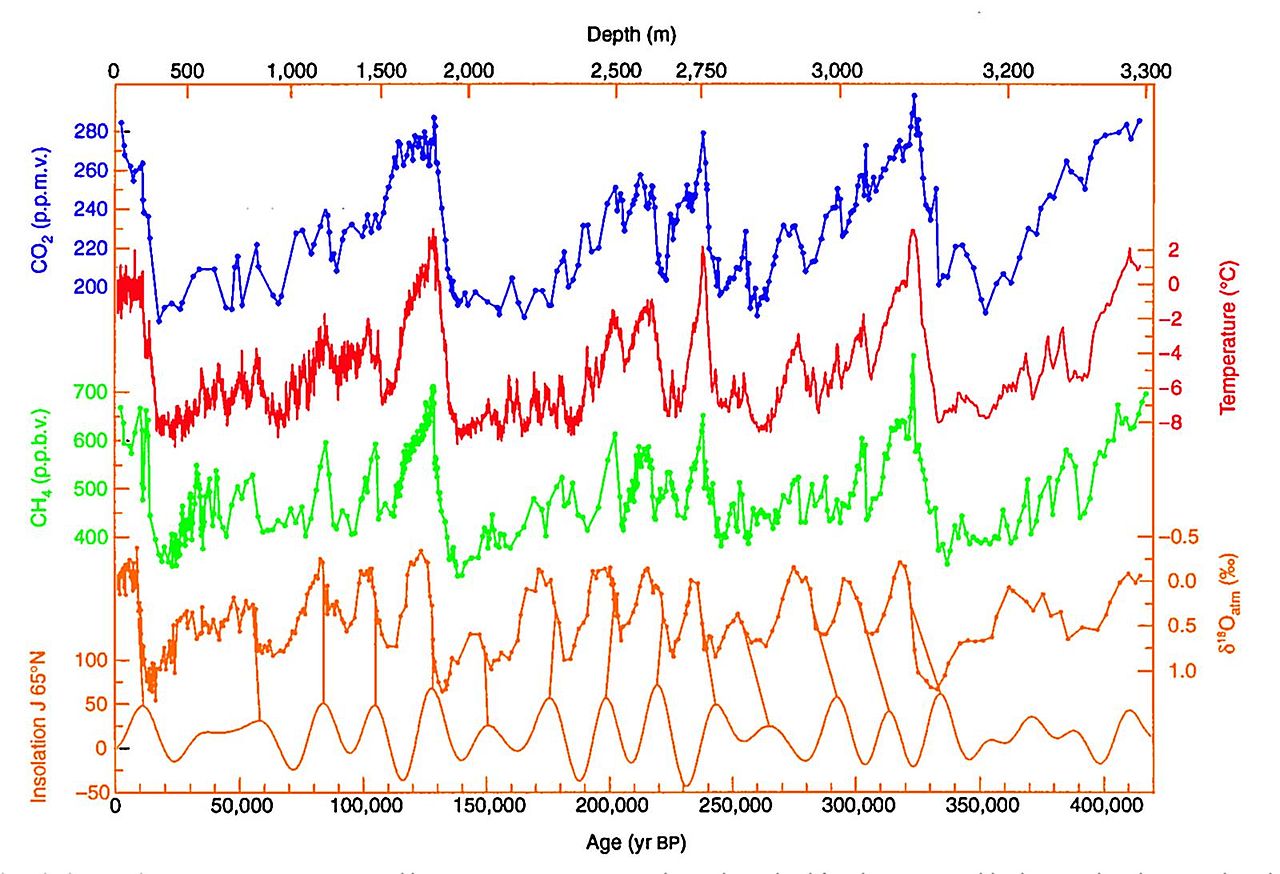
Climate data for the last 400,000 extracted from ice cores in Antarctica. Notice, the axis for carbon dioxide only reaches 280 ppm; today's concentrations are significantly higher. Image from Wikimedia Commons (public domain).
3. Quantifying past and present biodiversity
In many places, the geohistorical record can provide us with a long-term perspective extending backwards to a time before humans were modifying ecosystems—tens, if not hundreds, of thousands of years in the past. These records can give us an indication of the biodiversity that occurred naturally. This is an important contribution, as the effects of humans and their actions on biodiversity are often underappreciated and, in some cases, extinctions have occurred without people noticing. For example, the extinction of the aquatic fern, Azolla nilotica, was only recognized after Birks (2002) examined sediment cores from lakes in the Nile River delta (Egypt), which showed the plant was present in the area until the mid-twentieth century and has subsequently died out.
Geohistorical records are also time-averaged (learn more about time-averaging) and, in this context, time-averaging can be very useful. A time-averaged assemblage contains a theoretically representative sample of the community that lived throughout the duration of time-averaging (e.g., hundreds or thousands of years). As a consequence, more species are found in these types of assemblages than would be expected based on comparison to living communities. Time-averaged assemblages capture transient and/or rare species in the community, which are challenging to sample in living communities. Though time-averaging can be a negative in some cases, when it comes to quantifying biodiversity it can also be a positive effect because it allows for the inclusion of species that would likely be missed otherwise.
4. Detecting recent shifts in species abundances
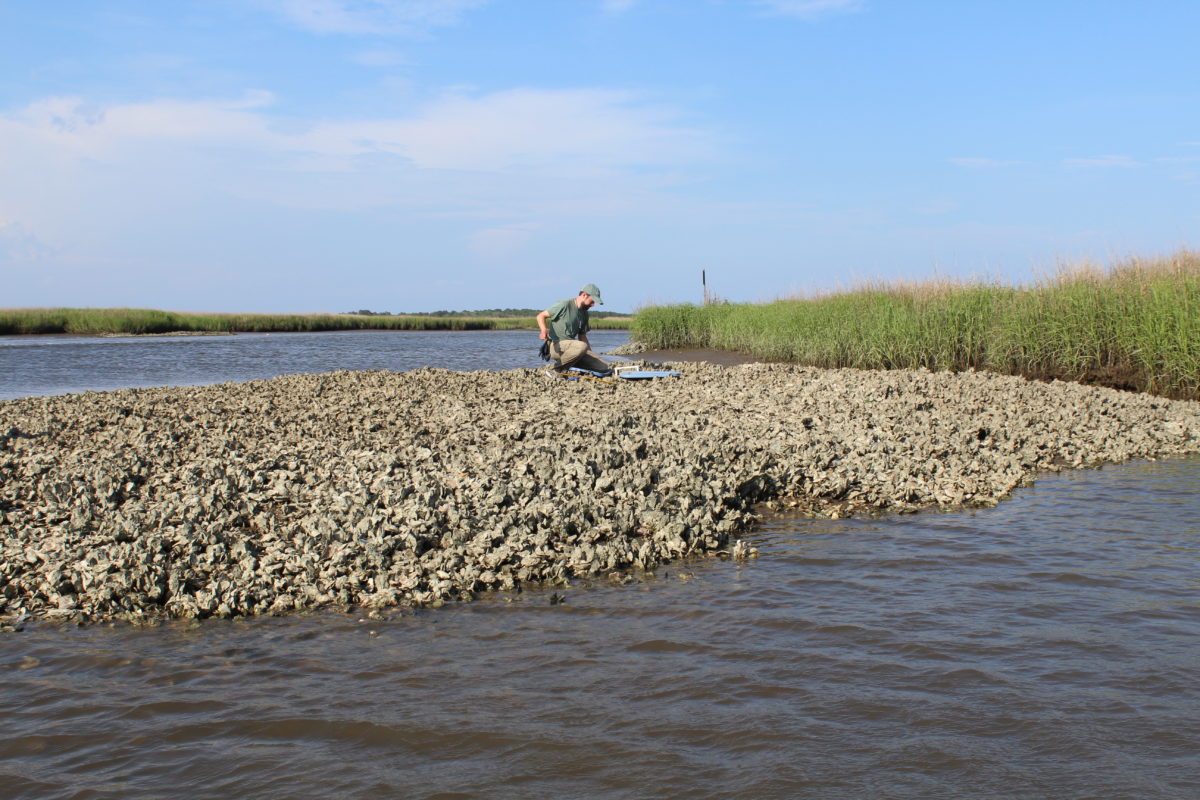
Human actions do not always result in the extinction of species. Instead, the abundances of species in ecosystems might change. In marine settings, changes to species abundances are commonly used to detect the effects of human actions by comparing the living community to the accumulate dead shells in the associated sediments. These “live-dead” comparisons use simple metrics like richness, evenness, taxonomic similarity, and rank-order abundance to determine whether a community has changed. In many cases, changes can be linked to specific human actions, like overfishing or eutrophication (i.e., excessive nutrient input, commonly leading to depletion of oxygen in a body of water), which can in turn inform the conservation measures that would be appropriate to restore the community. In the Colorado River estuary, for instance, Kowalewski et al. (2000) compared accumulations of dead shells to the live population of Mulinia modesta. These researchers found that the population may have declined by as much as 94%, likely as a consequence of changing habitat conditions associated with the damming of the Colorado River during the twentieth century. Restoration of this population, and the broader estuarine community, will likely require an increase in annual freshwater flows to the estuary (learn more about habitat change in the Colorado River estuary).
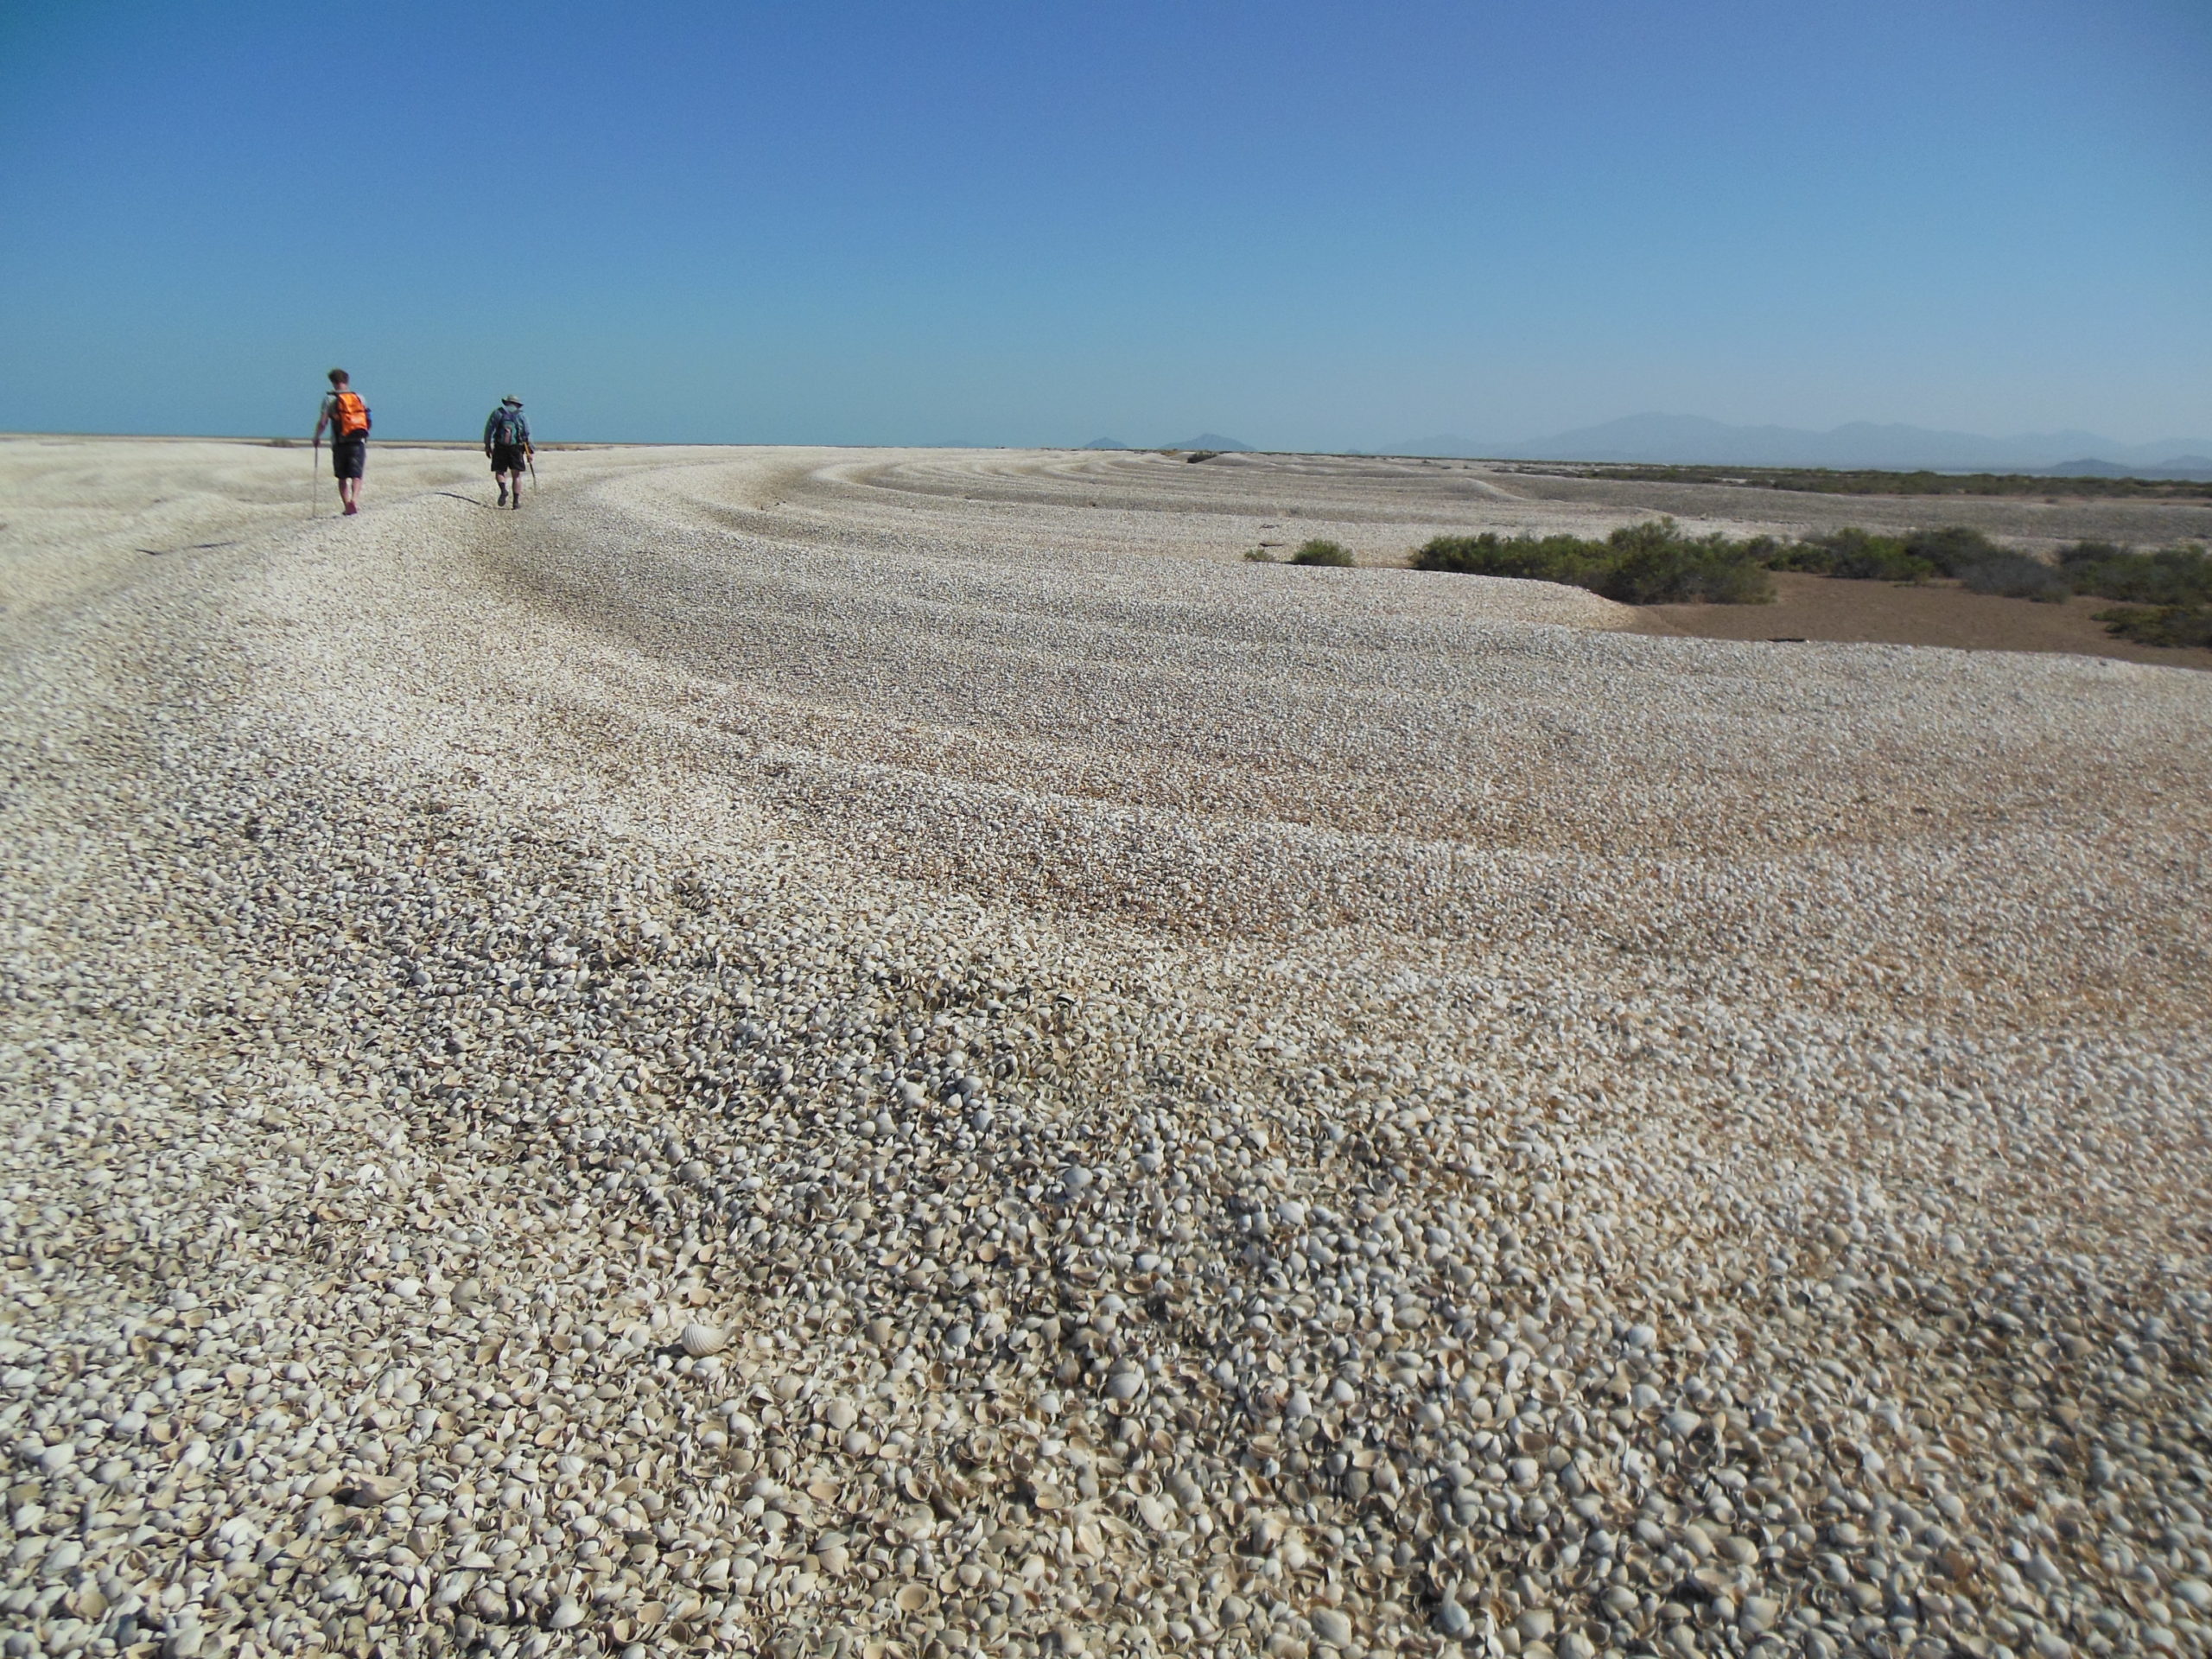
Accumulations of seashells in the Colorado River estuary. The majority of the shells in this image are Mulinia modesta and it has been estimated that there are more than two trillion of their shells in these accumulations. Photo by Jansen Smith.
5. Anticipating shifts in species geographic ranges
As the climate continues to warm and ecosystems continue to change, conservationists are building scenarios of the future to inform their decision-making process. Once again, geohistorical records can contribute to the development of these conservation tools. Much as these records can help identify non-native species and past species abundances, they can be used to determine how species were geographically distributed in the past. Geohistorical records from times in the past when the climate was warmer may be especially useful at present. For example, Powell et al. (2019) compared the past and current distributions of two clams, Arctica islandica and Spisula solidissima, using surveys of their living populations and occurrences of their dead shells. They found that the dead shells were much more broadly distributed than individuals in the living populations. The data for Arctica suggest that they are moving to deeper, colder waters as the ocean warms and they can no longer live in the more nearshore habitats they once occupied. Arctica will likely continue to occupy a more restricted range in the future. Spisula is also responding to warming ocean waters, but by expanding its range in concert with the warming waters. In habitats that are currently too cold, occurrences of dead Spisula shells suggest an even more expansive range in the future. As the climate continues to warm, geohistorical records can continue to provide useful information such as this.
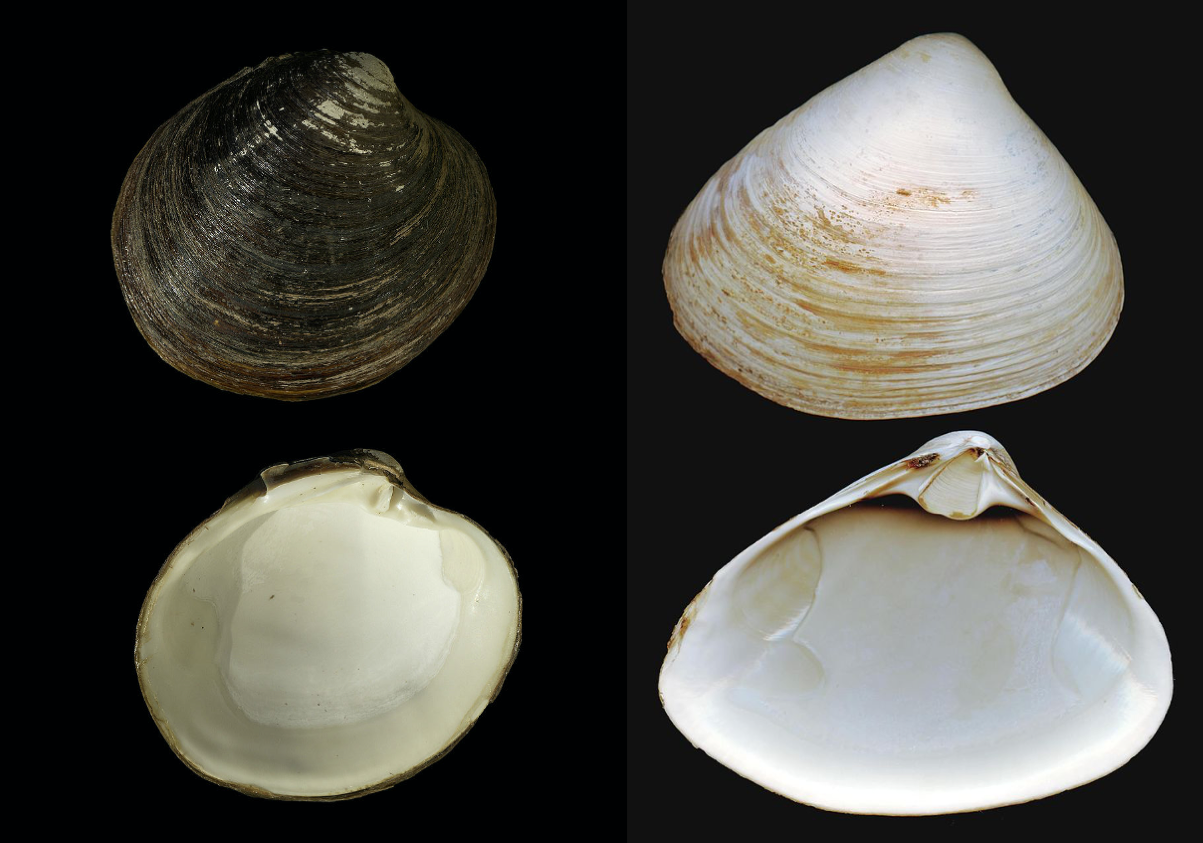
The clams Arctica islandica (left) and Spisula solidissima (right) studied by Powell and his colleagues. Left images by Hans Hillewaert; Creative Commons Attribution-Share Alike 4.0 International license. Right images by Invertzoo; GNU Free Documentation License.
6. Assessing changes in genetic diversity and identity
When working with the youngest portion of the fossil record—from the last few hundred years—improving genetic techniques have made it possible to asess ancient DNA. This newly accessible information makes it possible to evaluate the genetic consequences of past population declines and to identify the genetic provenance of living populations. For example, Heupink et al. (2012) reported that the king penguin population from Macquarie Island has recovered more than 85% of its genetic diversity after extensive exploitation nearly drove this species extinct in the 1800s. Essentially, ancient DNA can be used to set goals for the recovery of populations and their genetic structure.
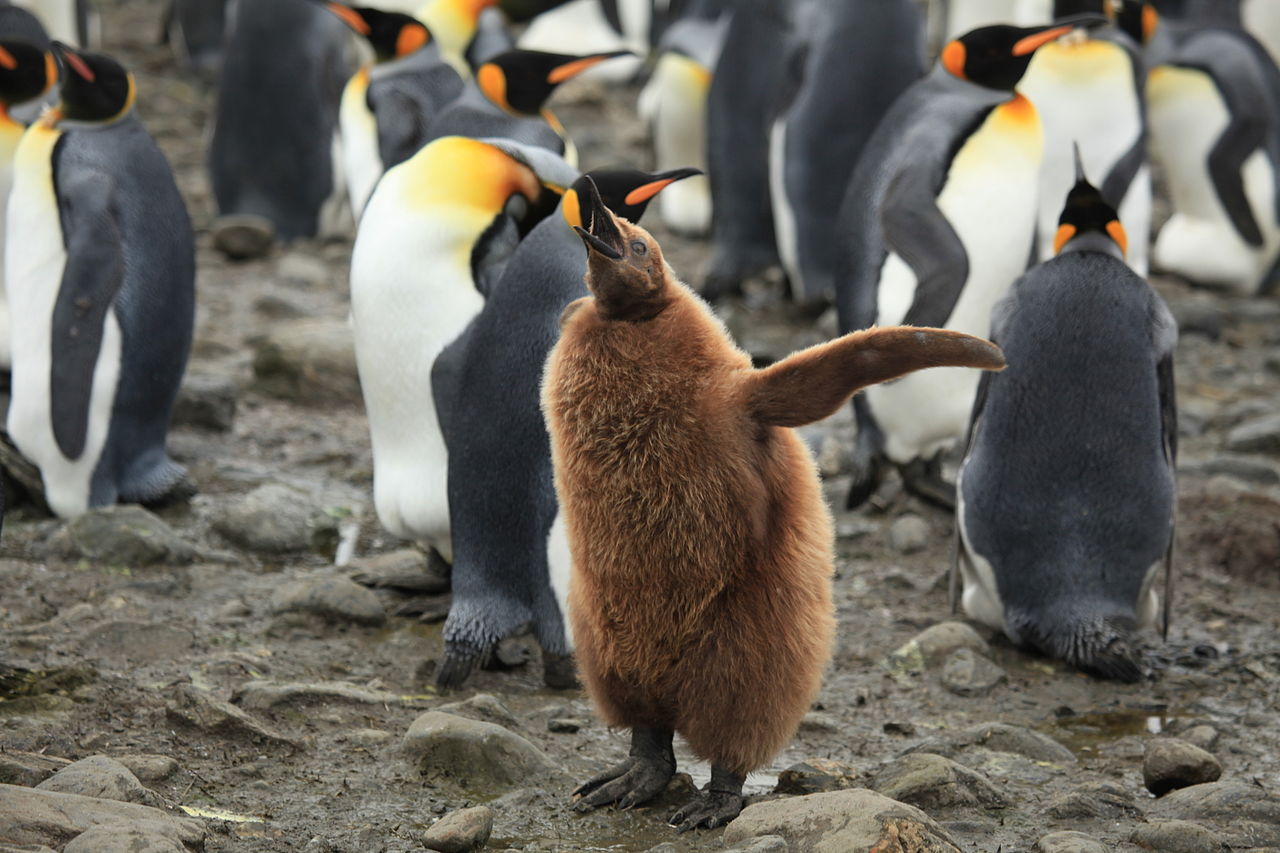
A colony of king penguins, including a juvenile (foreground). Image by Liam Quinn; Creative Commons Attribution-Share Alike 2.0 Generic license.
.jpg)
7. Documenting shifting baselines
Shifting baseline syndrome was discussed by Pauly (1995) and describes the susceptibility of people to unconsciously “forget” about past conditions. This effect can occur from generation to generation as older people move on and new people enter conservation or from year to year as individuals discount their past experiences. Regardless, the effect can be detrimental to conservation efforts because it causes people to lose sight of what was truly natural and can skew the goals of conservation practice.
Learn more about shifting baseline syndrome in this video, "Daniel Pauly: The ocean's shifting baseline" by TED. Source: YouTube.
To illustrate this issue, we can consider fishers in the Gulf of California. A team of researchers led by Andrea Sáenz-Arroyo (2005) surveyed three generations of fishers and found a strong shift in perceptions. The older generation was able to name five times as many species and four times as many fishing sites as the younger fishers. Moreover, when asked to quantify their largest catches, older fishers reported catches 25 times larger than those of their younger counterparts. This rapid shift in perspective contributes to the shifting baseline syndrome. The geohistorical record can help address this problem by providing a true record of the baseline, and the variability inherent to that baseline.
8. Disentangling human impacts from natural processes
Human actions are undoubtedly changing the world around us, but natural processes also have the capacity to produce change. When attempting to take conservation action, knowing the source of a potential problem, particularly whether it is an artificial or natural phenomenon, is critical. Geohistorical records can be used to determine the source. In a now famous example, geohistorical records from lake cores were used to link acidification in lakes to human industrial production. The cause of the acidification remained controversial during the 1970s and 1980s as there was no conclusive link between the acidification and human actions. After examining the relationship between diatom communities and acidic conditions, Charles and Smol (1990) were able to demonstrate using community changes that only lakes downwind of industrial sources exhibited acidification. Upwind lakes did not show the same effects, even as deeper cores showed upwind and downwind communities were similar originally. Geohistorical records provided the critical link to determine that the acidification was from a human source and not a natural one (e.g., bedrock composition, nutrient cycling).
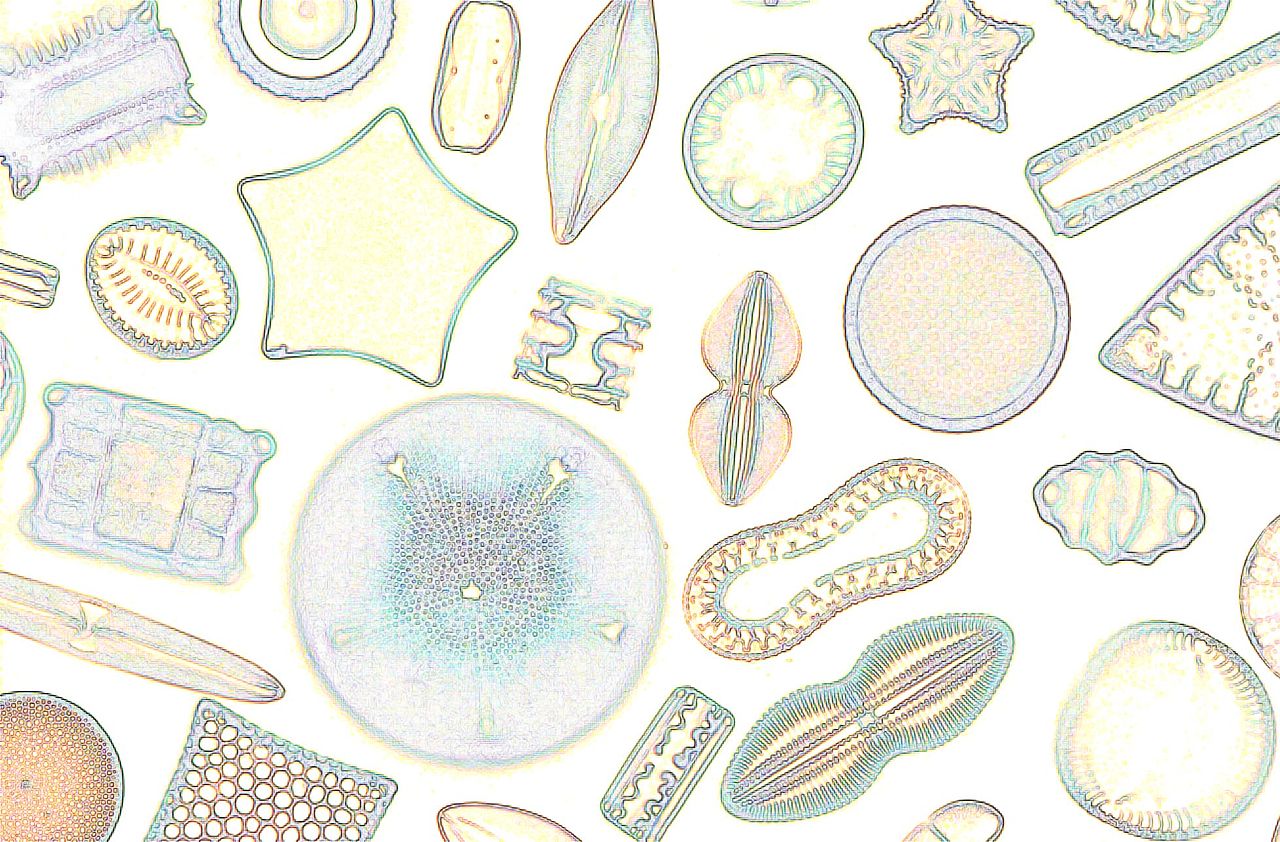
A hand-drawing showing a variety of different diatom forms, the majority of which are too small to be viewed by the human eye and require a microscope to view. Artwork by Rovag; Creative Commons Attribution 3.0 Unported license.
9. Developing restoration targets
The Everglades wetlands in Florida, which include Everglades National Park (a World Heritage Site), have declined by as much as 50% due to an altered hydrologic regime, and diversions for agriculture and development. Starting in the late 1990s, there has been a broad push to restore this unique ecosystem over the next 30 – 50 years. In the absence of long-term ecological studies, the paleoecological record can be used to understand how the Everglades have responded to past hydrological changes during the last several thousand years and applied to set targets for today’s restoration efforts.
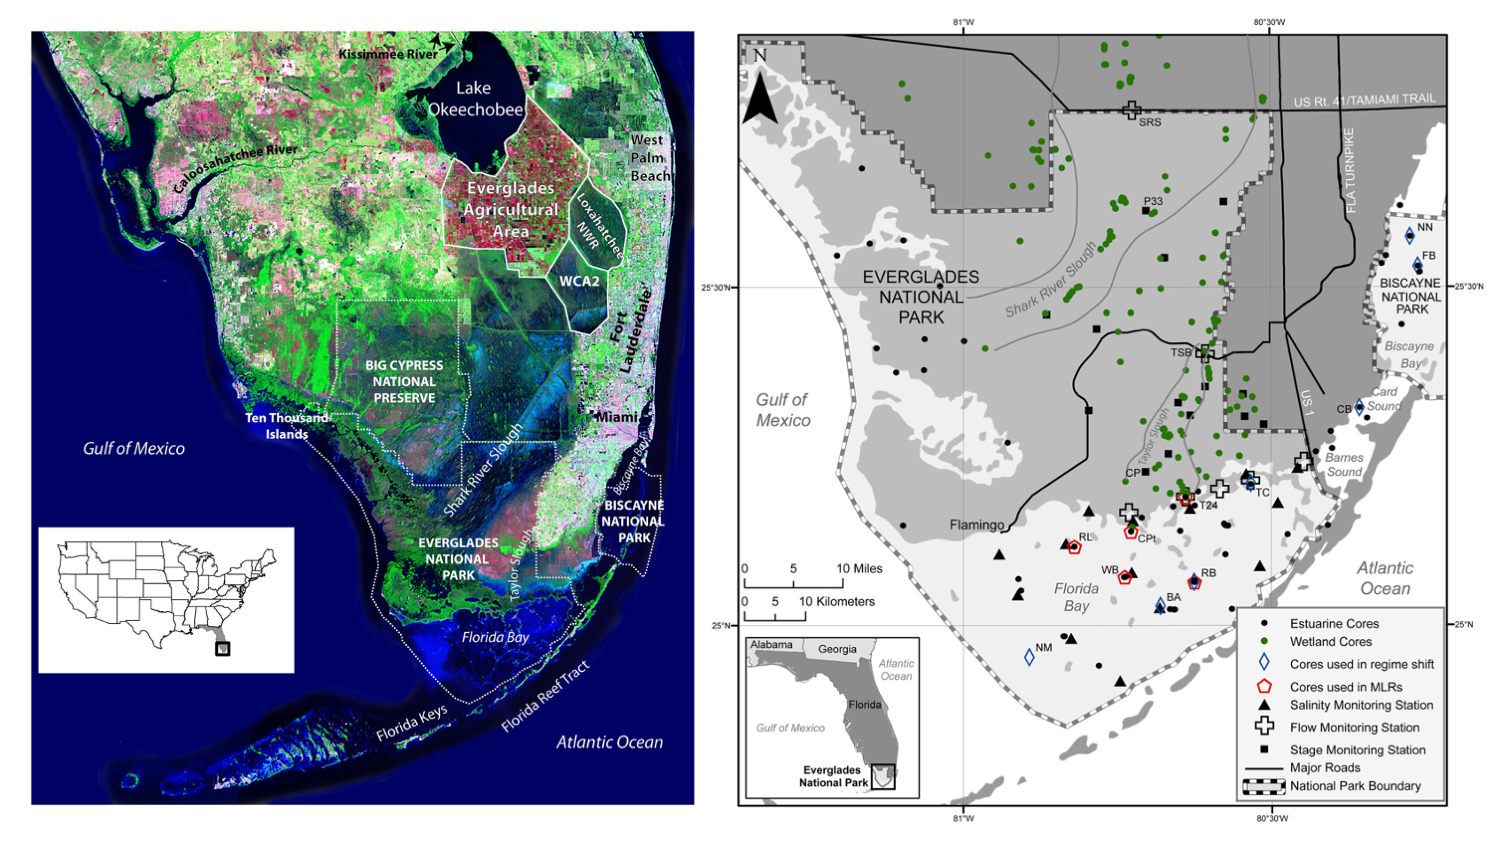
Left caption: "Satellite image of South Florida showing features discussed in text. Arthur R. Marshall Loxahatchee National Wildlife Refuge (labeled Loxahatchee NWR) is also Water Conservation Area (WCA) 1. Only the mouth of the Kissimmee River is shown where it empties into Lake Okeechobee; the river begins just south of Orlando and is considered the headwaters of the Everglades. White dotted lines indicate the boundaries of the National Park Service lands. Source of background image is USGS 1993 South Florida Satellite Image Map. United States index map shows location of Florida (gray) and satellite image (black box). Right caption: "Map of south Florida showing location of cores and monitoring stations. Cores used for the regime shift analyses and the multiple linear regression models (MLRs) discussed in the text are indicated and specific monitoring stations discussed are labeled." Figures and captions from Wingard et al. (2017) in Frontiers in Ecology and Evolution; Creative Commons Attribution 4.0 International license.
As discussed by Wingard et al. (2017), the paleoecological record shows several key elements in the Everglades. For example, the ridge and slough landscape, with tree island communities, originated during dry periods in the past, allowing the establishment of the structure that defines the Everglades today. Human controlled changes to the hydrological regime are causing similar effects today, as reduced variability in seasonal water flows are creating drier habitats where wetlands existed for several centuries. Sea level rise, combined with reduced freshwater input, is also changing the ecosystem. Sediment cores show that where there were once freshwater mangrove communities, there has been a gradual transition to estuarine and fully marine habitats. Multiple proxies for environmental conditions, from diatoms, ostracods, mollusks, and foraminifera, all show a similar trend towards increased local salinity.
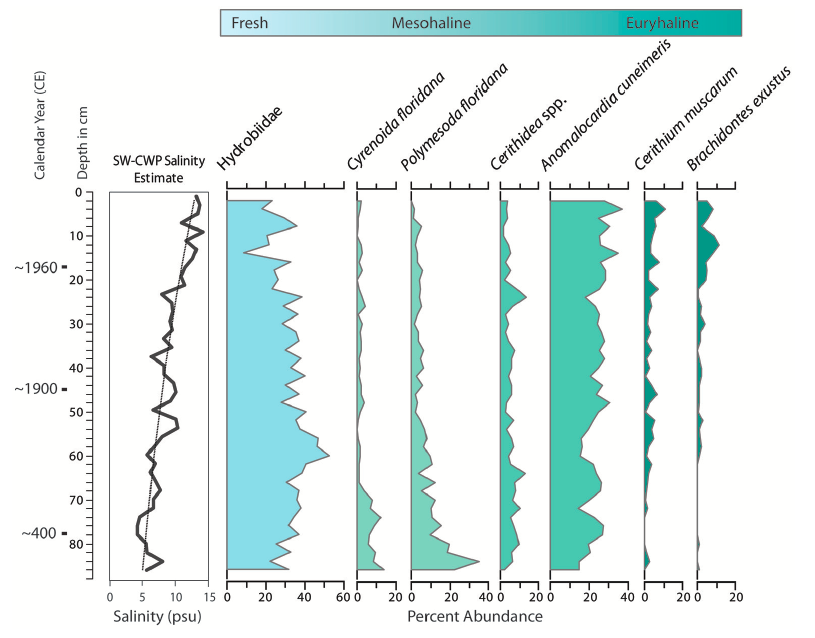
"Changes in molluscan assemblages from core collected at the mouth of Taylor Creek, northern margin of Florida Bay (T24, Figure 2), which indicate increases in salinity at the site over time. Species-weighted cumulative weighted percent (SW-CWP) value is shown on the far left (see text and Wingard and Hudley, 2012 for explanation of CWP). Species are arranged from left to right, ranging from freshwater to species that tolerate wide fluctuations in salinity (euryhaline)." Figure and caption from Wingard et al. (2017) in Frontiers in Ecology and Evolution; Creative Commons Attribution 4.0 International license.
These data show that an ecological regime shift started during the 1950s and 1960s. Using information on mollusks in the cores, Wingard and her colleagues were able to model a time series for salinity in the Everglades, providing insight on how the system functioned prior to extensive recent disturbance by people. They found salinities would be 3 – 9 psu lower today in the absence of freshwater diversions, corresponding to 2.1 – 3.7 times more freshwater flow than is currently present. With this set of information available, decisions about restoration in the Everglades can be made with a robust geohistorical perspective, increasing the likelihood that restoration actions are a success
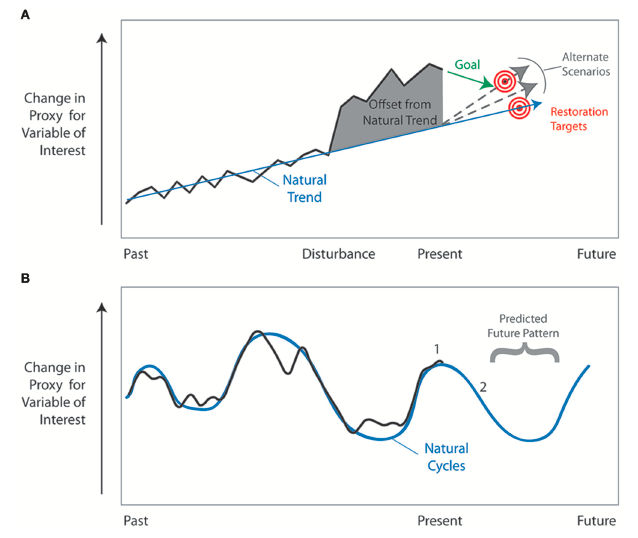
"Schematic diagrams illustrating application of long-term records to understanding past history of ecosystem and forecasting future change. (A) Proxy data indicate change in some variable in the past and a trend can be detected. Offset from the natural trend (gray area) occurs after disturbance. Restoration targets (red bull’s eye) and goals should be to restore the ecosystem to the natural trajectory of change—not to the pre-disturbance condition. Alternate targets and scenarios (gray dashed lines) can be proposed to adjust natural trends for offsets due to drivers and stressors beyond the control of land management agencies (for example, rising sea level or climate patterns). (B) Illustration of long-term cyclic change. These cycles can be projected into the future providing resource managers an understanding of expected changes. It is important to recognize if an ecosystem currently exists at an inflection point (1) and change is expected (2)." Figure and caption from Wingard et al. (2017) in Frontiers in Ecology and Evolution; Creative Commons Attribution 4.0 International license.
10. Evaluating extinction risk
The fossil record spans hundreds of millions of years and is full of originations and extinctions of species. Understanding why species go extinct under different environmental pressures can help us identify at-risk species today. For example, Boyer (2009) used the occurrences of fossil and living bird species to evaluate the importance of abiotic and ecological factors in bird extinction on islands. Boyer’s analysis showed that ecological traits, including endemism, body size, and diet, were more likely to predict an extinction than abiotic factors such as the size of the island and its isolation. Using this information, greater care can be taken to protect the bird species that are more susceptible to extinction.
11. Informing decisions on rewilding
Of the restoration strategies to be proposed, rewilding is among the most controversial. Rewilding entails the replacement of a species—often an extinct one—that was important in ecosystem function with an ecologically similar species, even if from a different region. This might include, for example, introducing lions, cheetahs, and elephants to North America to replace the megafauna that went extinct around 12,000 years ago. Though this concept may seem implausible, not all rewilding includes such large and potentially obtrusive animals.
On the Hawaiian island of Kauai, the fossil record found in Makauwaki Cave by David Burney and his team (2012) includes the remains of a large flightless bird. Now extinct, this bird played an important role in regulating near-ground vegetation and dispersed seeds of the plants it consumed. As it is no longer possible to restore the bird population, conservationists turned to another animal to fill the vacant role: sulcata tortoises. A number of these large tortoises have been released at the Makauwaki Cave Reserve, where they are now performing a similar function to the extinct birds.
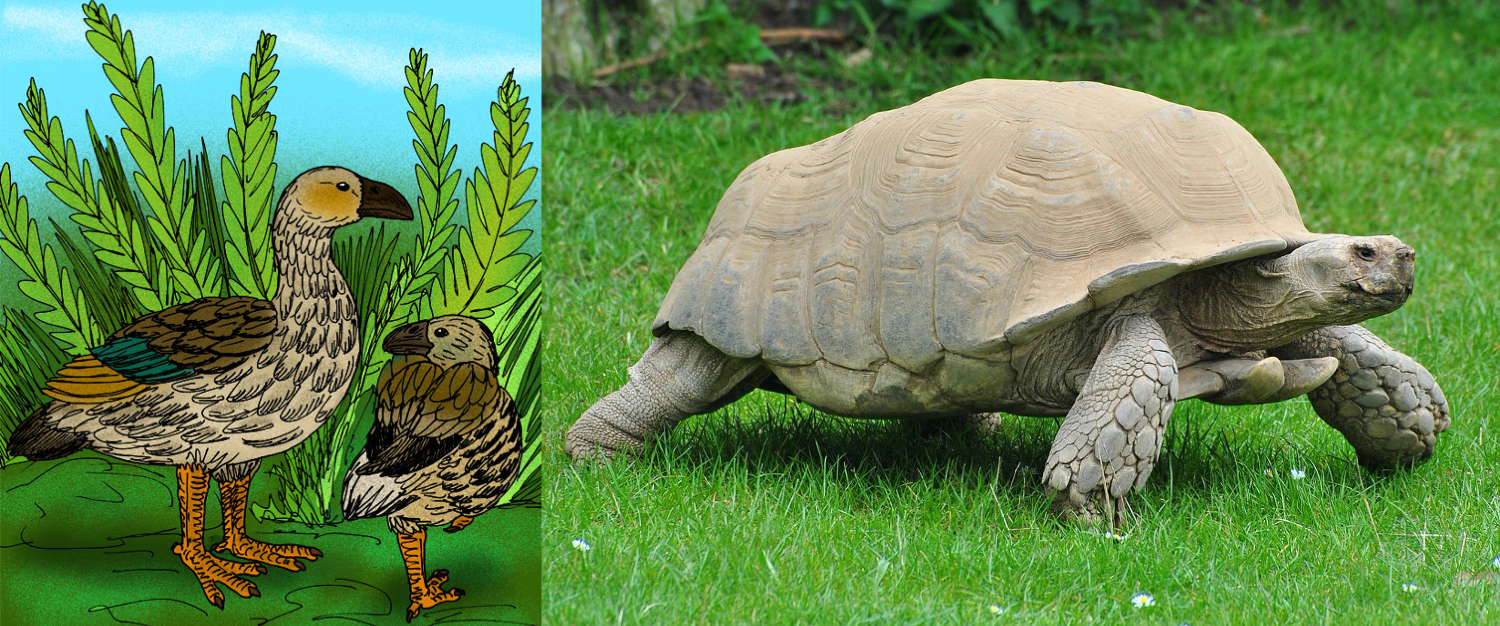
A reconstruction of the now-extinct "moa nalo" ground birds from Hawai'i (left) and a sulcata tortoise (right) such as those rewilded on Kauai to replace the ecological function of the birds. Left image by Apokryltaros; GNU Free Documentation License. Right image by John5199; Creative Commons Attribution 2.0 Generic license.
_(8679964197).jpg)
12. Strategies for the design and selection of reserves
Creating a nature reserve is a challenging process with numerous variables to navigate, one of which is selecting an area where a certain species, community, or ecosystem can thrive. This challenge is only compounded by the changing climate and formation of novel ecosystems. Geohistorical records can provide additional information to help identify areas where success is more likely. Instead of predicting where species will move in the future based on where they currently live, the geohistorical record can be used to show where species actually lived in the past, when the climate was warmer. For example, the work by Powell and his colleagues with clams (discussed above) could be applied to identify an appropriate location for a reserve, if conserving those clam populations was identified as a priority. Geohistorical records are an additional tool that can help increase the likelihood of conservation success.
13. Establishing conservation priorities
In conservation, there is a long-standing and continuing debate on the need to prioritize efforts, acknowledging that some species go extinct and some ecosystems will not readily be conserved. Whereas some have argued that this triage is unnecessary, given the vast resources of the modern world, others have pointed to a lack of political will and financial support to suggest it is an unavoidable reality. If triage is necessary—as is suggested by events to this point—data from geohistorical records can help set priorities. For example, a team of researchers led by John Pandolfi (2003) used the geohistorical record to identify coral reef systems that were more or less degraded. By comparing the structure of the communities in the past to the communities alive today, they provided in-depth insight into which communities are most at risk of irreversible damage. Using this information, conservation efforts can be focus in those areas where efforts are deemed most needed, or most likely to succeed.
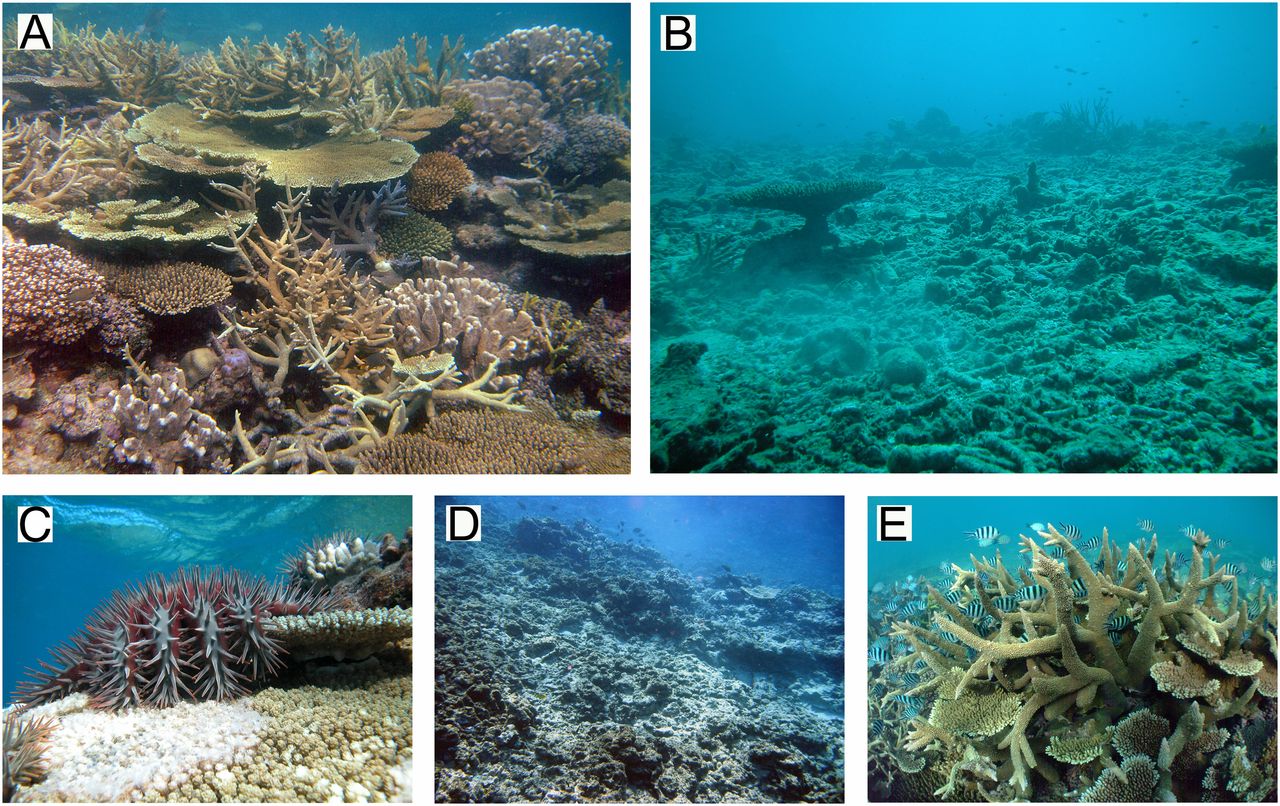
A sampling of healthy and degraded coral reefs. "[Great Barrier Reef]. (A) High coral cover is typical of the far northern GBR, where disturbances by cyclones and crown-of-thorns starfish are infrequent. (B) Repeated outbreaks by the coral-eating crown-of-thorns seastars have devastated reefs like that shown here. (C) Crown-of-thorns seastars feed on coral. (D) Tropical cyclones are also a major cause of recent coral mortality, as illustrated by a reef seen a few months after it was hit by a category 4 cyclone. (E) Structures provided by reef-building corals are an essential habitat for many of the hundreds of thousands of species associated with coral reefs. (Photographs courtesy of Katharina Fabricius, Australian Institute of Marine Science.)" Image and caption from Knowlton (2012) in Proceedings of the National Academy of Science under the PNAS License to Publish (Copyright (2012) National Academy of Sciences)
Concept check: See what you know!
True or False: The geohistorical record is too incomplete to provide a sense of historical range of variability for a species or ecosystem.
False! Though the geohistorical record is not always 100% complete, the information it does contain can be very effective in establishing historical variability.
In your own words, what is shifting baseline syndrome?
Shifting baseline syndrome describes the "forgetfulness" of people regarding species and ecosystems in the past and the tendency of people to think recent conditions are representative of historical conditions.
What about "rewilding" makes it a controversial strategy?
Rewilding is the concept of bringing in a "new" species to replace an extinct (or depauperate) species, even when the new species did not live in the area historically. This idea clashes with the traditional goal of maintaining ecosystems with high historical fidelity.
How can the geohistorical record be used to distinguish between human and natural disturbances?
Geohistorical records provide a longer temporal perspective that can be used to refine estimates on timing of events. That is, the geohistorical record can show us whether a disturbance occurred before or after human arrival, or a specific human action.
In the context of conservation, what does "triage" mean?
In conservation, triage refers to the idea that it will not be possible to save all species, or all ecosystems, and so actions should be taken based on a prioritization of species or ecosystems.
References and Further Reading
Birks, H. H. 2002. The recent extinction of Azolla nilotica in the Nile Delta, Egypt. Acta Paleobotanica, 42: 203-213.
Boyer, A. G. 2010. Consistent ecological selectivity through time in Pacific island avian extinctions. Conservation Biology, 24: 511-519.
Burney, D. A., J. O. Juvik, L. P. Burney, and T. Diagne. 2012. Can unwanted suburban tortoises rescue native Hawaiian plants? The Tortoise, 1: 104-115.
Charles, D. F., and J. P. Smol. 1990. The PIRLA II project: regional assessment of lake acidification trends. Internationale Vereinigung für theoretische und angewandte Limnologie: Verhandlungen, 24: 474-480.
Dietl, G. P., S. M. Kidwell, M. Brenner, D. A. Burney, K. W. Flessa, S. T. Jackson, and P. L. Koch. 2015. Conservation paleobiology: leveraging knowledge of the past to inform conservation and restoration. Annual Review of Earth and Planetary Sciences, 43: 79-103.
Heupink, T. H., J. van den Hoff, and D. M. Lambert. 2012. King penguin population on Macquarie Island recovers ancient DNA diversity after heavy exploitation in historic times. Biology Letters, 8: 586-589.
Keeling, C. D. 1960. The concentration and isotopic abundances of carbon dioxide in the atmosphere. Tellus, 12: 200-203.
Jackson, J. B., M. X. Kirby, W. H. Berger, K. A. Bjorndal, L. W. Botsford, B. J. Bourque, et al. 2001. Historical overfishing and the recent collapse of coastal ecosystems. Science, 293: 629-637.
Kidwell, S. M. 2013. Time‐averaging and fidelity of modern death assemblages: building a taphonomic foundation for conservation palaeobiology. Palaeontology, 56: 487-522.
Pauly, D. 1995. Anecdotes and the shifting baseline syndrome of fisheries. Trends in Ecology & Evolution, 10: 430.
Sáenz-Arroyo, A., C. Roberts, J. Torre, M. Cariño-Olvera, and R. Enríquez-Andrade. 2005. Rapidly shifting environmental baselines among fishers of the Gulf of California. Proceedings of the Royal Society B: Biological Sciences, 272: 1957-1962.
Pandolfi, J. M., R. H. Bradbury, E. Sala, T. P. Hughes, K. A. Bjorndal, R. G. Cooke, et al. 2003. Global trajectories of the long-term decline of coral reef ecosystems. Science, 301: 955-958.
Smith, J. A., and G. P. Dietl. 2016. The value of geohistorical data in identifying a recent human‐induced range expansion of a predatory gastropod in the Colorado River delta, Mexico. Journal of Biogeography, 43: 791-800.
Volety, A. K., M. Savarese, S. G. Tolley, W. S. Arnold, P. Sime, P. Goodman, et al. 2009. Eastern oysters (Crassostrea virginica) as an indicator for restoration of Everglades ecosystems. Ecological Indicators, 9: S120-S136.
Usage
Unless otherwise indicated, the written and visual content on this page is licensed under a Creative Commons Attribution-NonCommercial-Share Alike 4.0 International License. This page was written by Jansen A. Smith. See captions of individual images for attributions. See original source material for licenses associated with video and/or 3D model content.
